



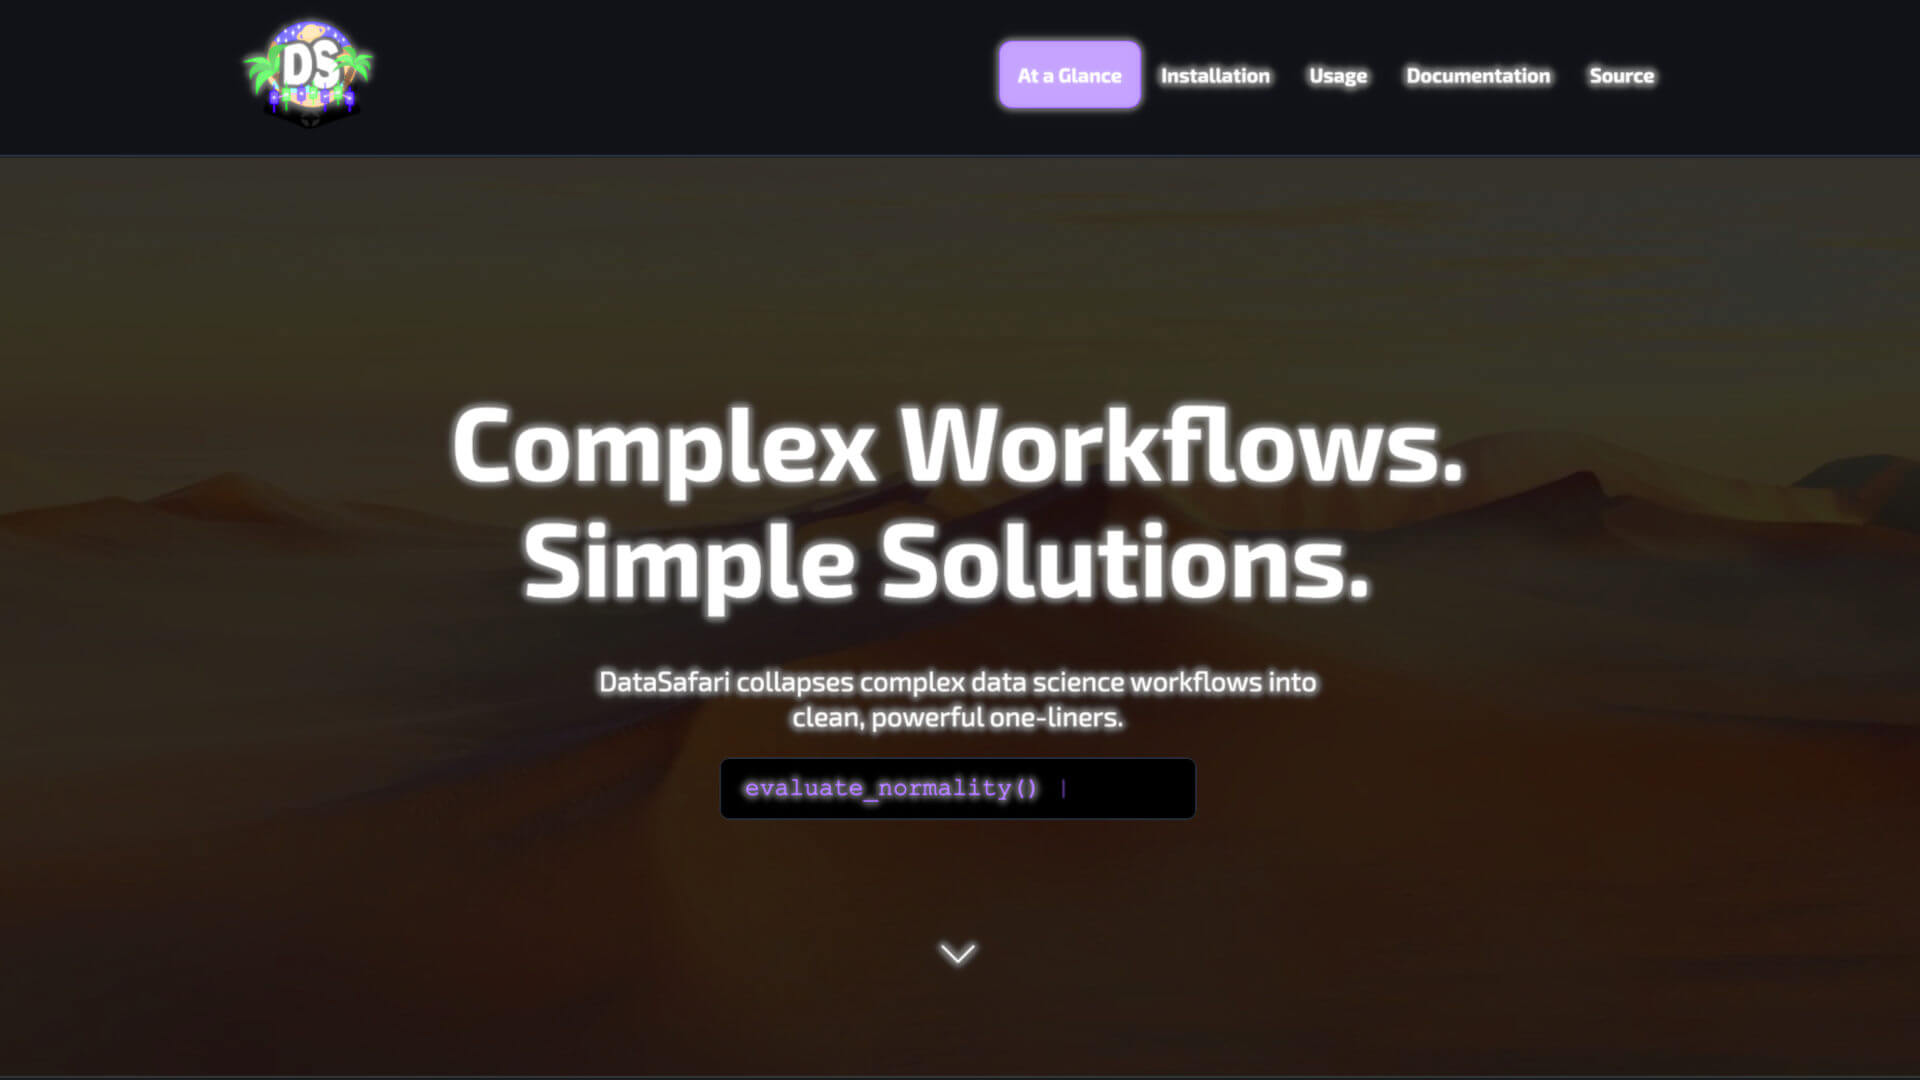
DataSafari is a Python library that simplifies complex data science tasks — compressing exploration, transformation, evaluation, and prediction into a single one-liner API. One import. One function call. One plain-English report.
George built DataSafari to solve a specific problem he watched play out at university: data science curricula built around Stata, R, and SPSS — tools with decades of academic inertia — while Python's better-maintained, faster, and more capable ecosystem went largely untaught. The researcher who understands their domain deeply but doesn't want to spend two hours reading Scipy docs to run a single test was the exact person the existing tooling failed. DataSafari is the attempt to fix that: one import, one function call, one plain-English report.
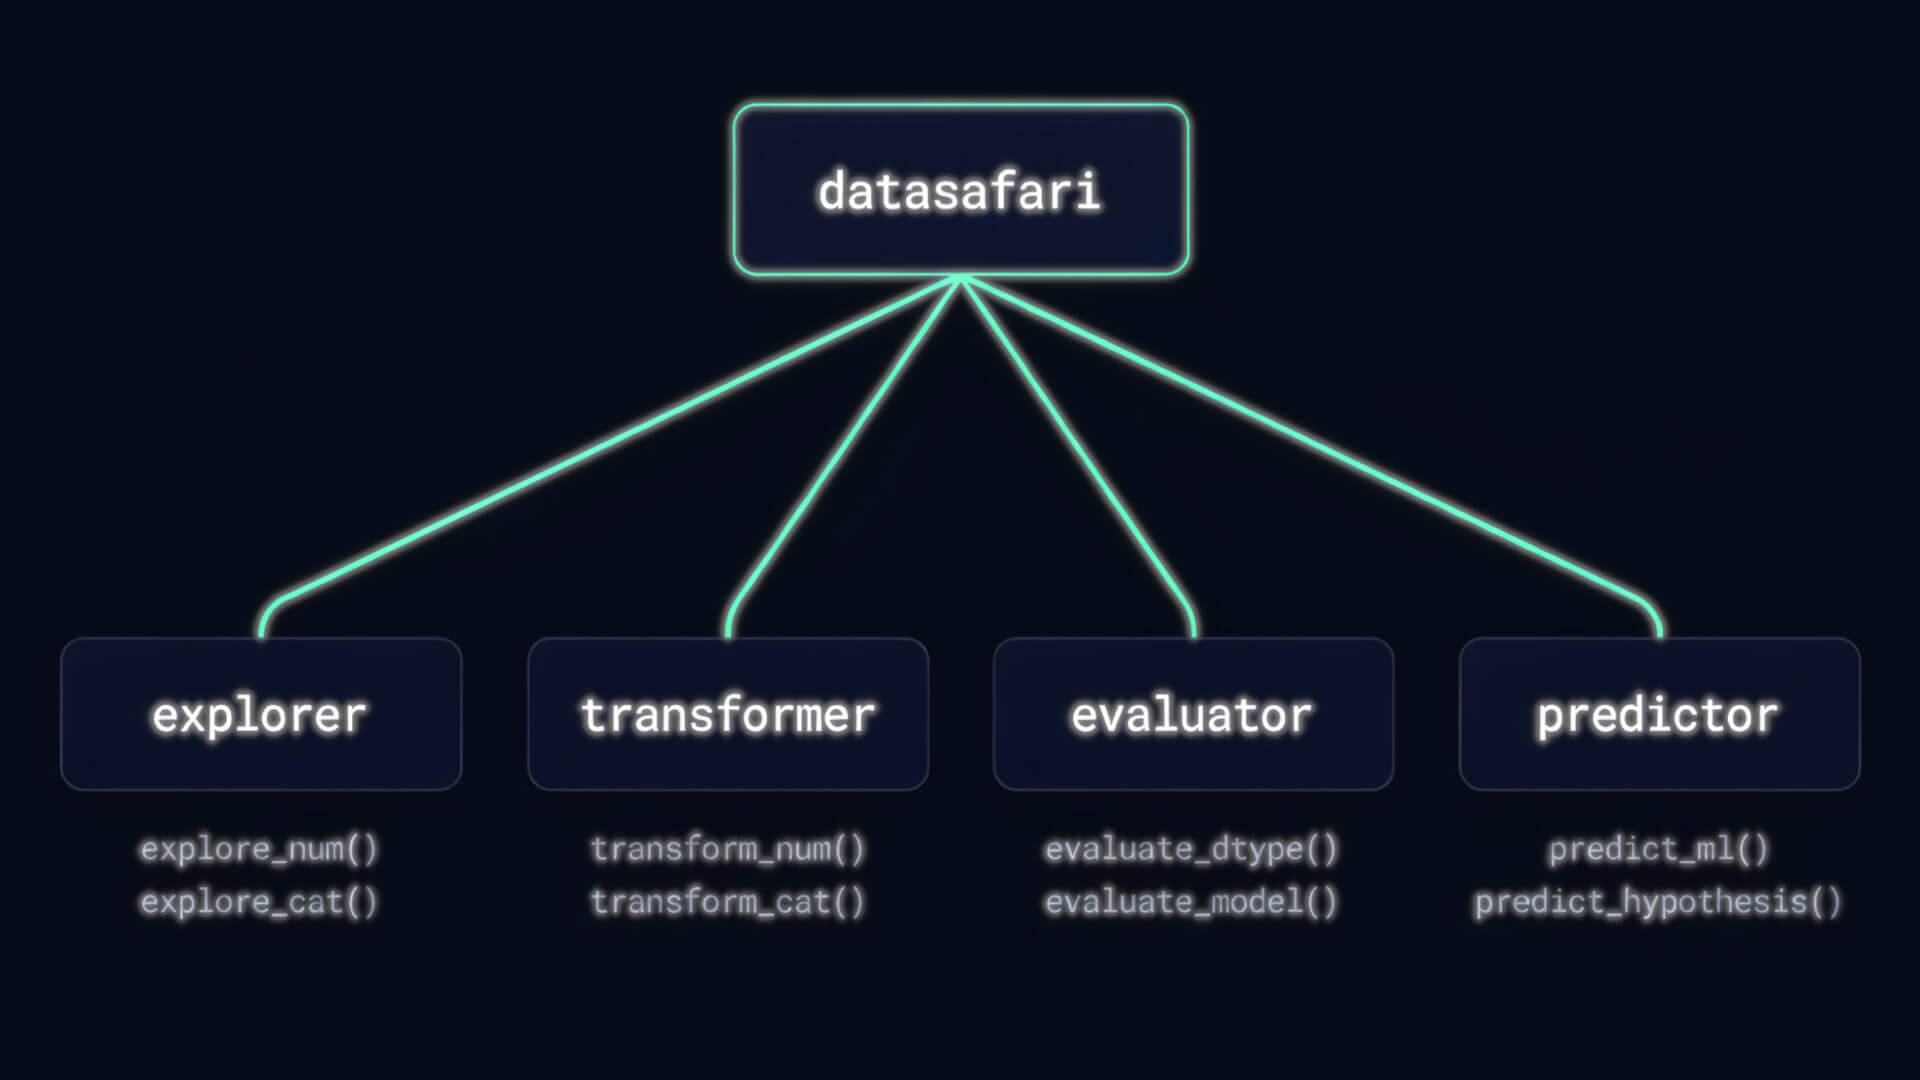
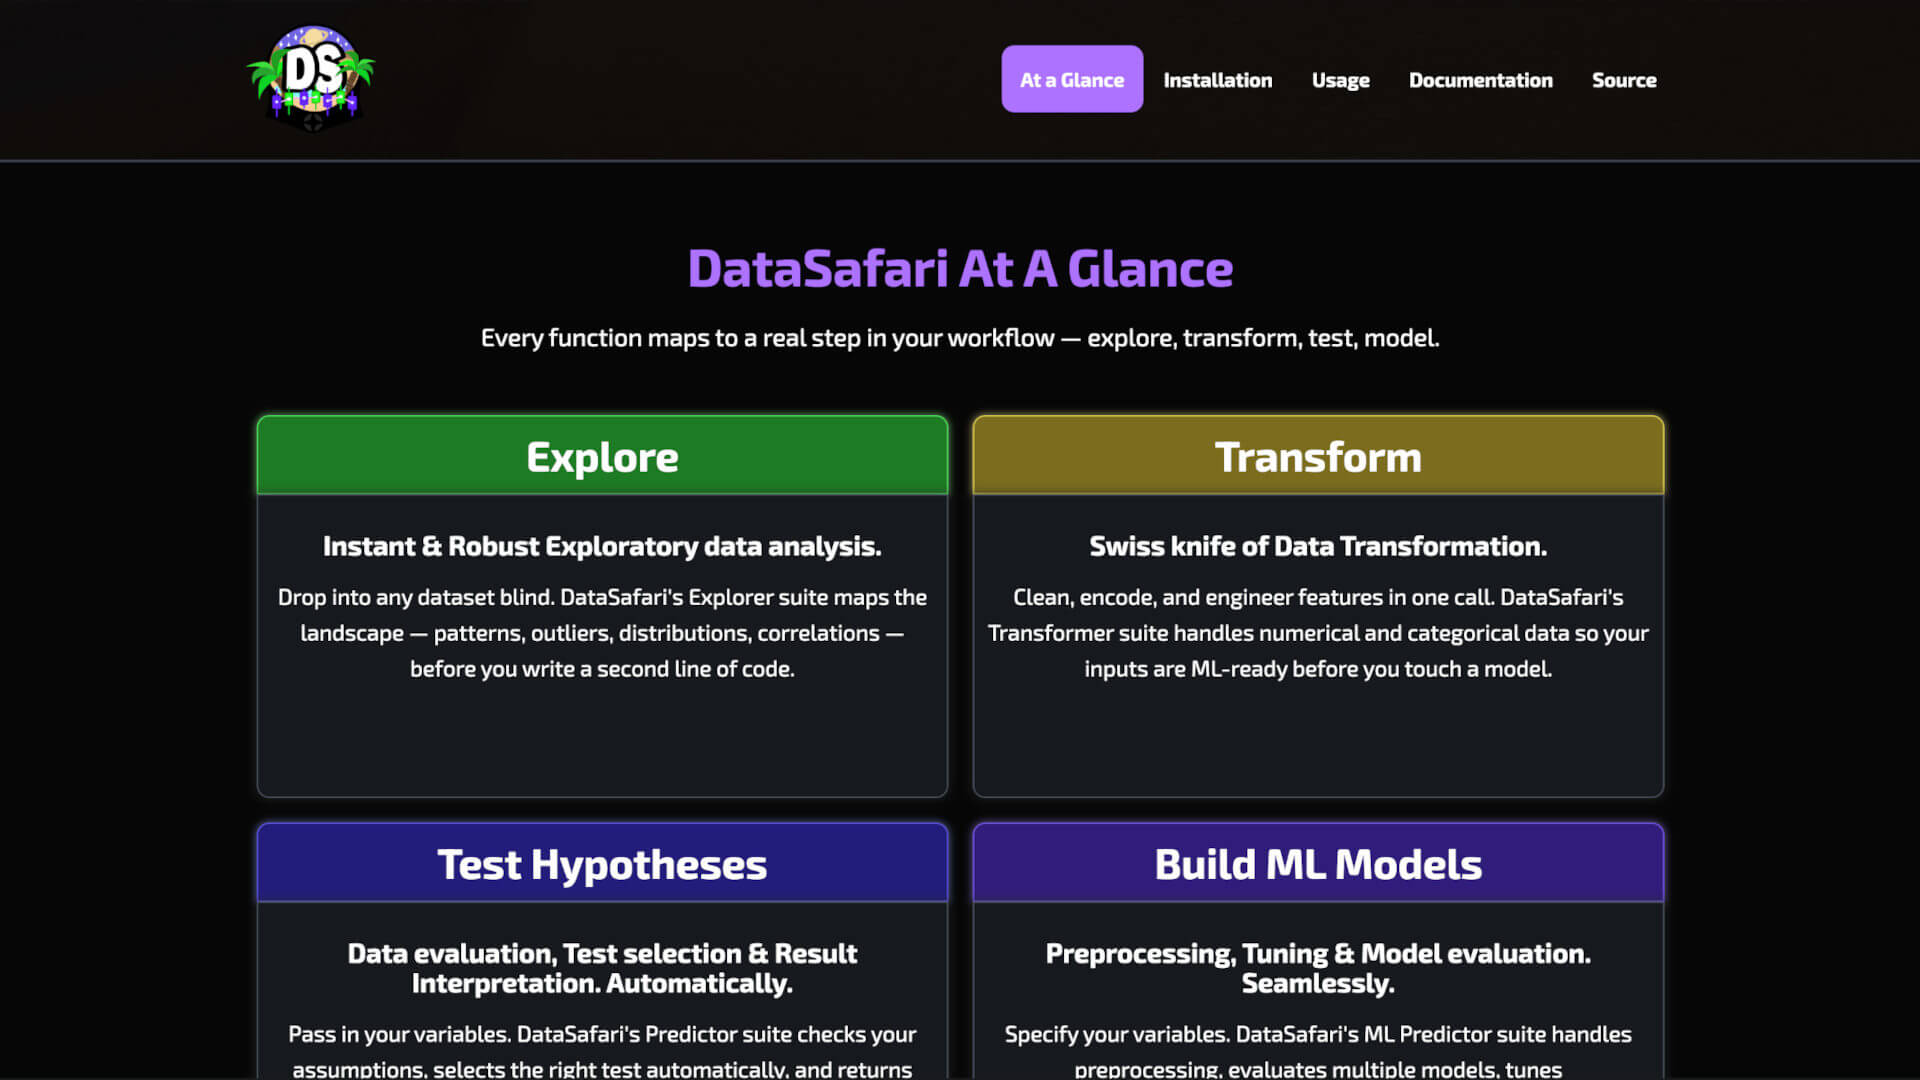
The library spans four subpackages — Explorer, Transformer, Evaluator, Predictor — mirroring the natural stages of any data workflow. Every function handles its stage end-to-end: automatic statistical method selection, dynamic assumption validation, composite-score model evaluation. Each call returns a plain-language report with findings and actionable recommendations — results that are interpretable, not just computed.
Highlights
Languages
 Python
 HTML
HTML
 CSS
CSS
 Bash / Zsh
Python Libraries
 pandas
 NumPy
NumPy
 SciPy
SciPy
 scikit-learn
scikit-optimize
category-encoders
scikit-learn
scikit-optimize
category-encoders
 PyTorch
 HuggingFace
Matplotlib
seaborn
HuggingFace
Matplotlib
seaborn
 Plotly
statsmodels
Plotly
statsmodels
Dev Toolchain
 pytest
tox
pytest
tox
 Sphinx
 Read the Docs
 PyPI
PyPI
 Poetry
 Setuptools
 GitHub Actions
Dev Tools & IDEs
 Jupyter
 DataSpell
 Git
Git
 GitHub
Platforms & Infra
 cPanel
 Namecheap
 Cloudflare
Design & Creative
 Illustrator
 Photoshop
Python Library Architecture
Designed the library from scratch as a four-subpackage system: Explorers, Transformers, Evaluators, and Predictors. The structure reflects the natural data science workflow. Built a consistent public API around a one-liner philosophy, making complex operations available through a single function with sensible defaults and room for deep customisation.
OSS Release Engineering
Managed the full open-source release lifecycle, from project scaffolding with Poetry and Setuptools to versioned PyPI distribution. Configured pyproject.toml, package metadata, and dependencies to produce reproducible builds that users can install with a single pip command.
Automated Test Suite Design
Built a test suite of more than 250 tests covering edge cases, input validation, and statistical output correctness across all subpackages. Configured tox to run the suite across multiple Python environments, helping datasafari work for as many users as possible.
CI/CD Pipeline Construction
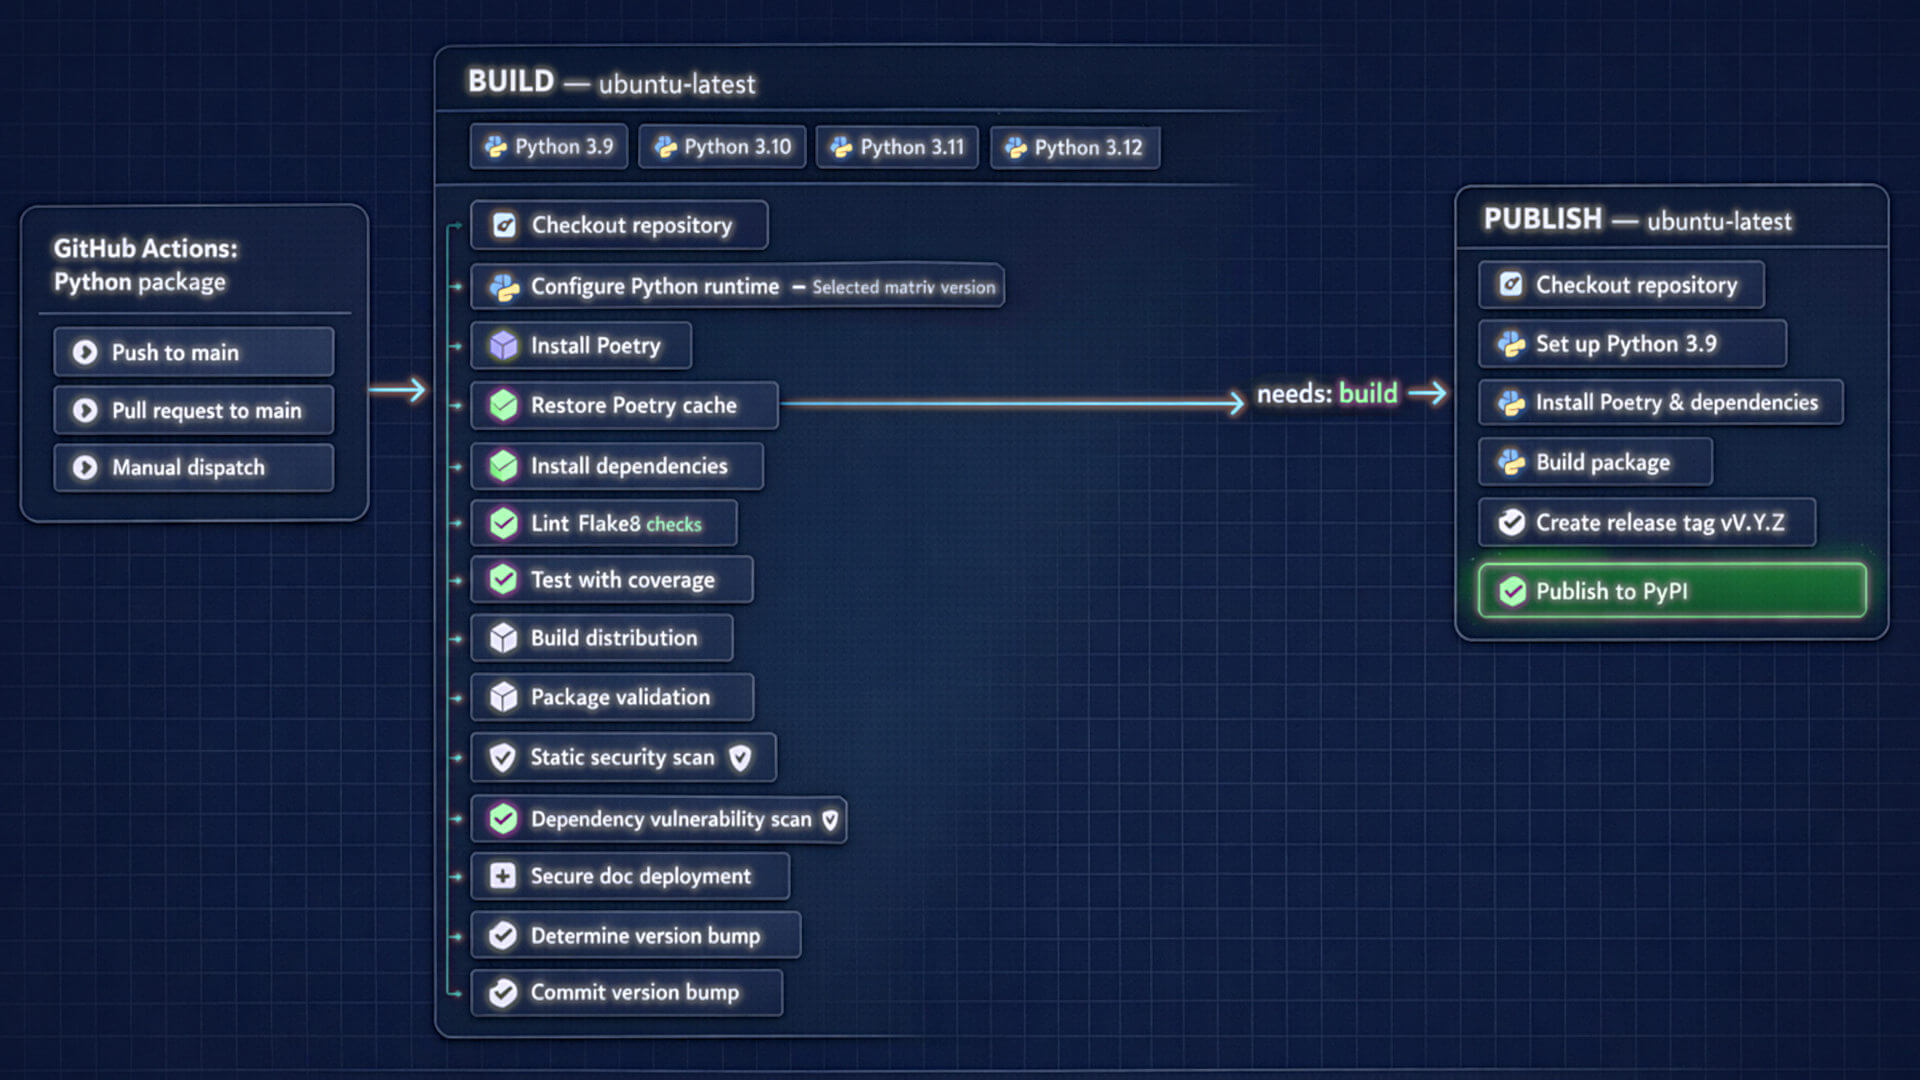
Designed and built a 12-step GitHub Actions pipeline that runs automatically on every push. It performs lint checks, runs the full tox test matrix, and publishes to PyPI when a release is tagged. Closed 136 issues over the life of the project, validating every fix through the pipeline before merge.
Technical Documentation Engineering
Built the complete datasafari documentation system, including Sphinx source authoring, an automated build pipeline, and a custom public site at datasafari.dev. Wrote every page of the documentation: installation guides, function references, usage examples, and conceptual explanations for all 11 modules.
Defensive Python & Input Validation
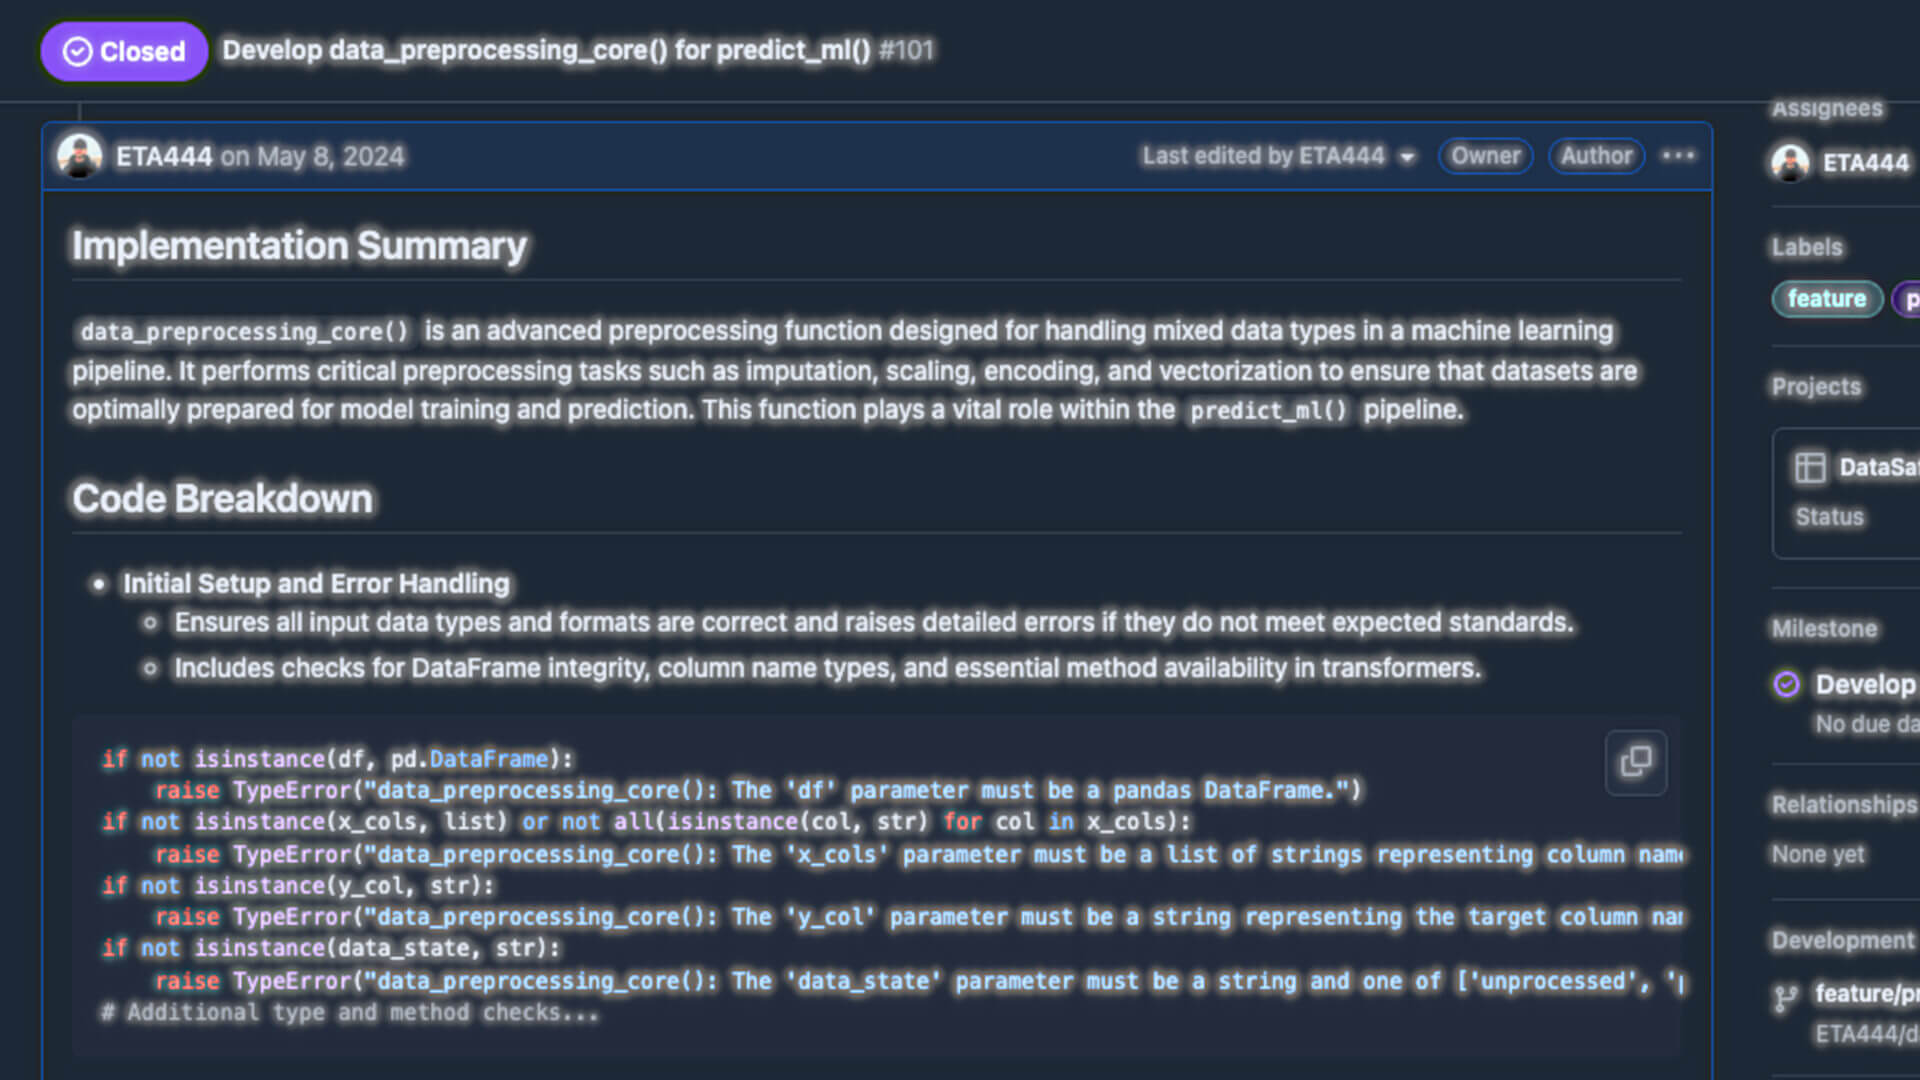
Implemented rigorous input validation and error handling across all 11 public functions. Each accepts DataFrames, column names, and optional parameter combinations that can fail silently in naive code. I built runtime branching logic to detect data types, sample sizes, and edge cases, then route execution to the correct algorithm path. Every error message is written for the caller, not the developer. In an API, the message is the UI & UX together.
Exploratory Data Analysis Systems
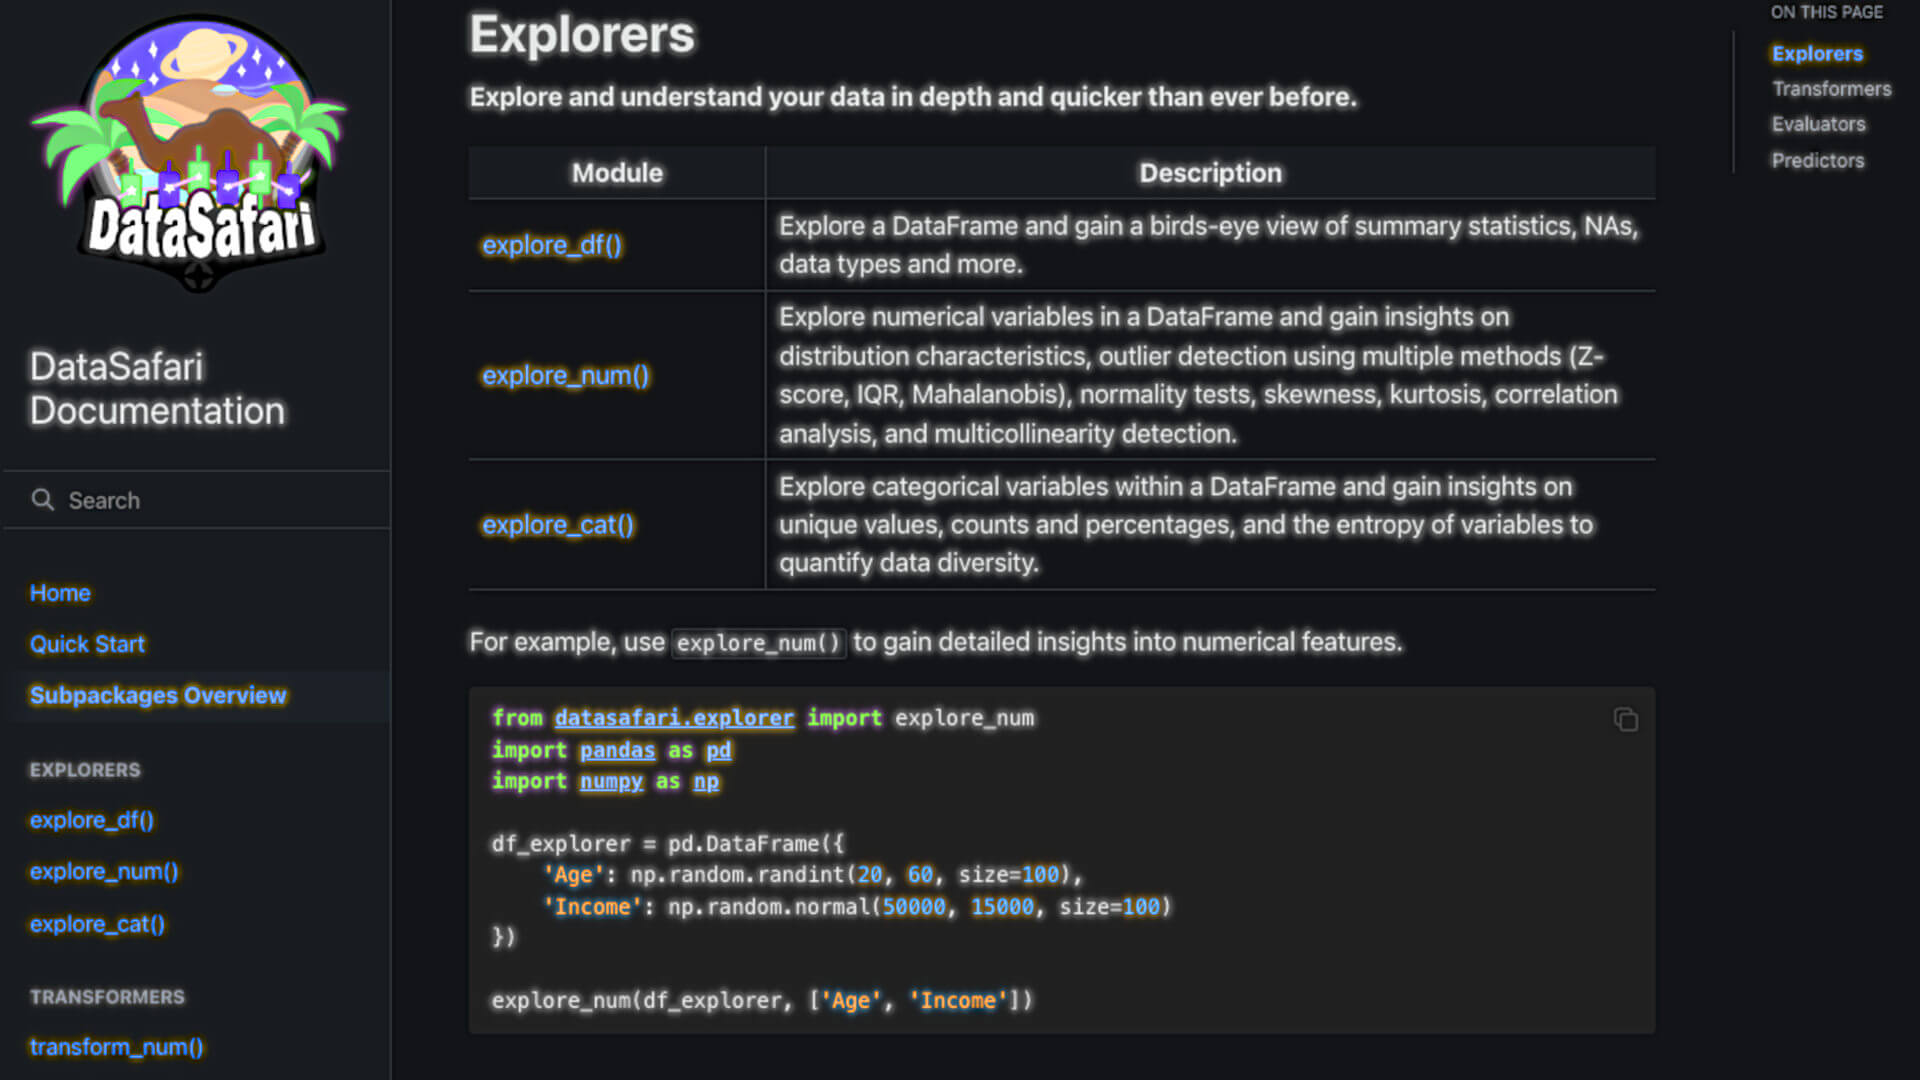
Designed and implemented the full Explorers subpackage. explore_df() profiles datasets, explore_num() performs numerical analysis including outlier detection via Z-score, IQR, and Mahalanobis distance, and explore_cat() profiles categorical data, including Shannon entropy to quantify diversity.
Statistical Assumption Verification
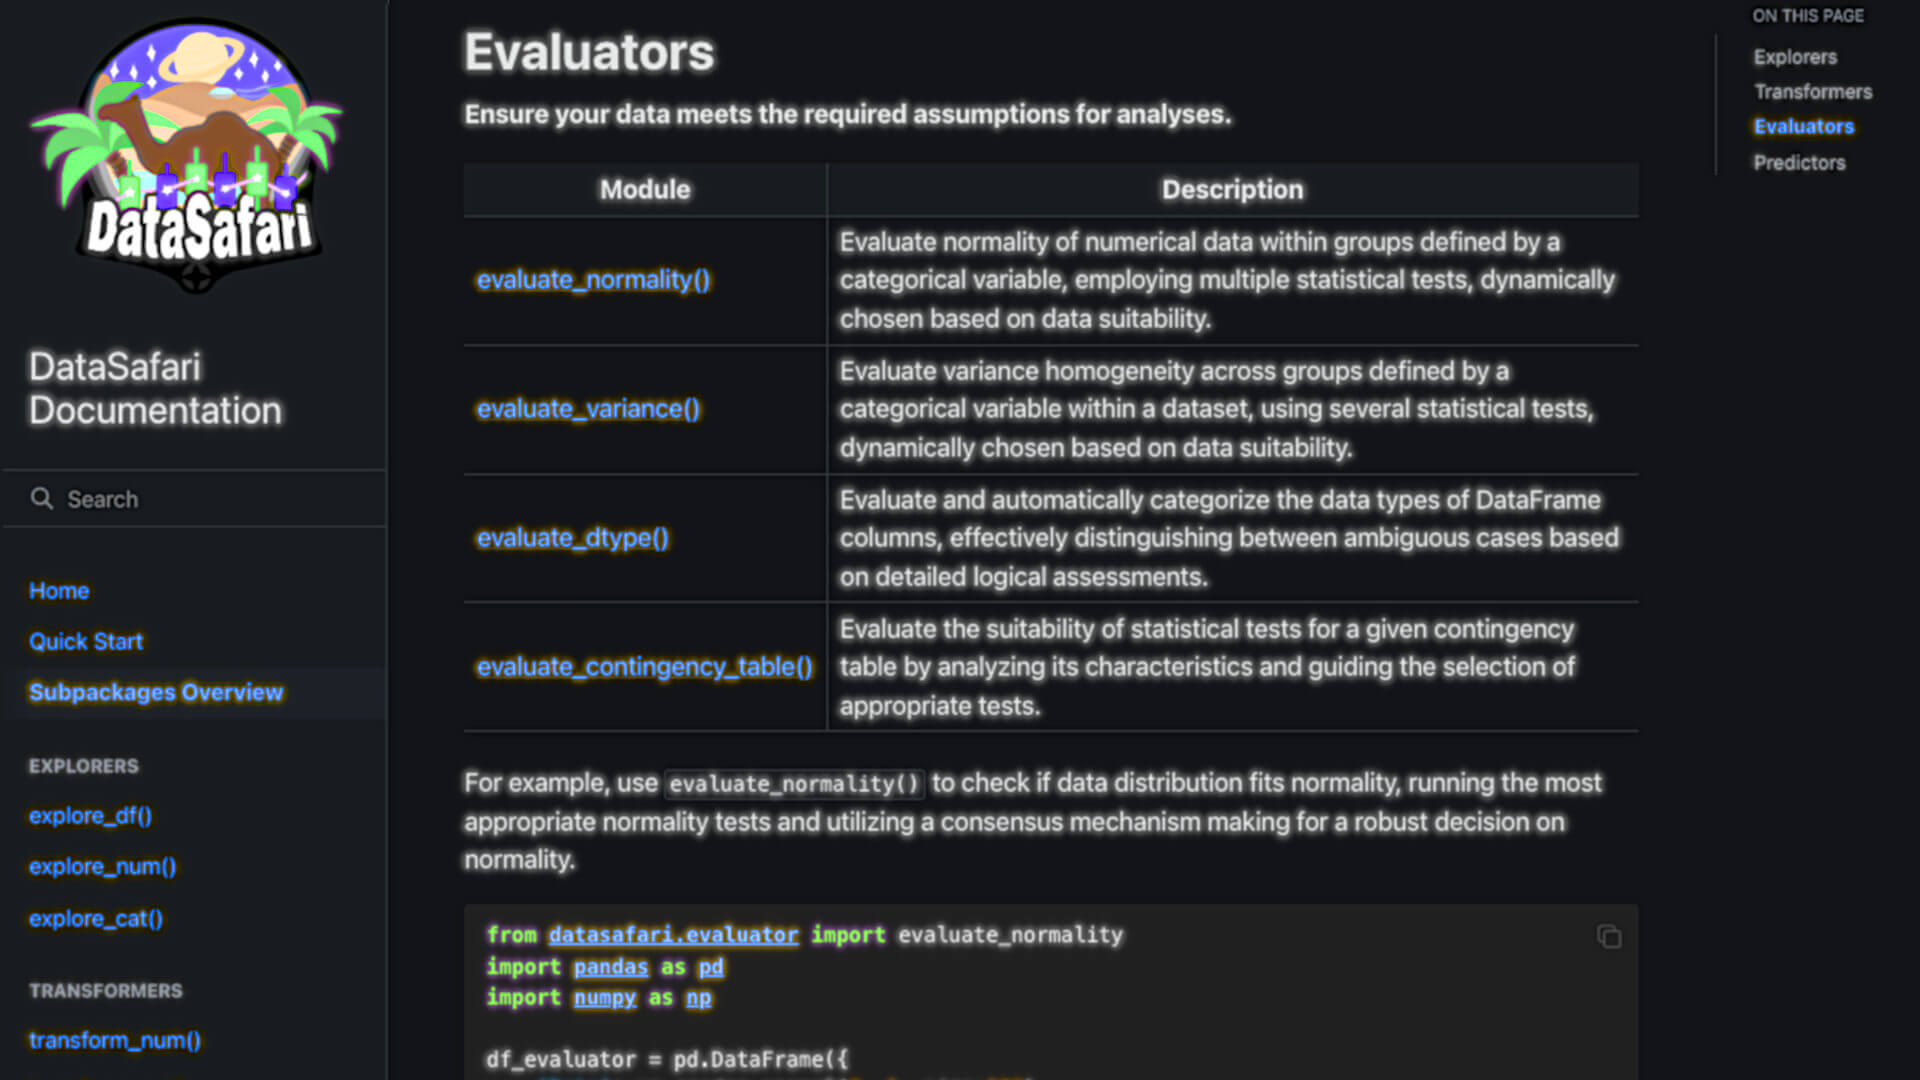
Built the Evaluators subpackage to automate the assumption checks that data scientists typically perform before analysis. evaluate_normality() selects an appropriate test, such as Shapiro-Wilk or Anderson-Darling, based on the sample; evaluate_variance() dynamically applies Levene's, Bartlett's, or Fligner's test; and evaluate_contingency_table() checks whether Chi-square conditions are met.
Automated Hypothesis Testing
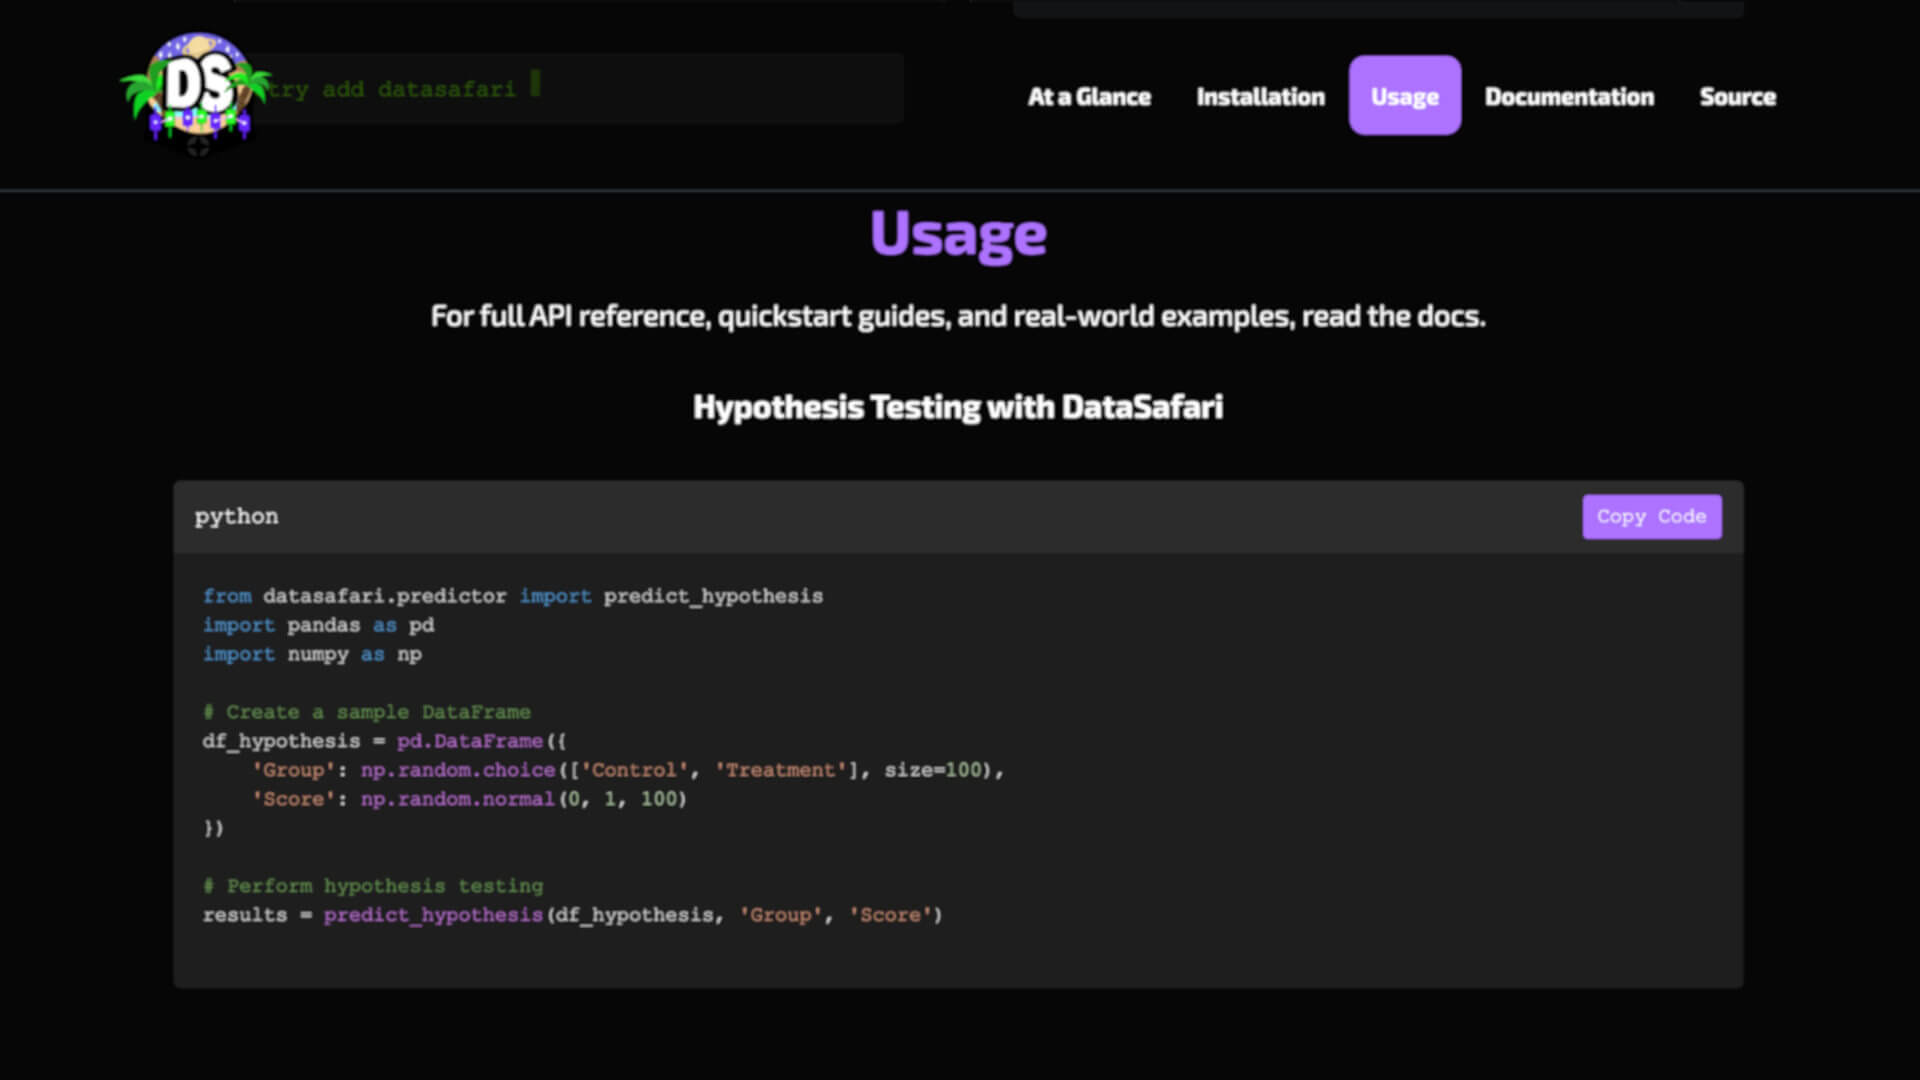
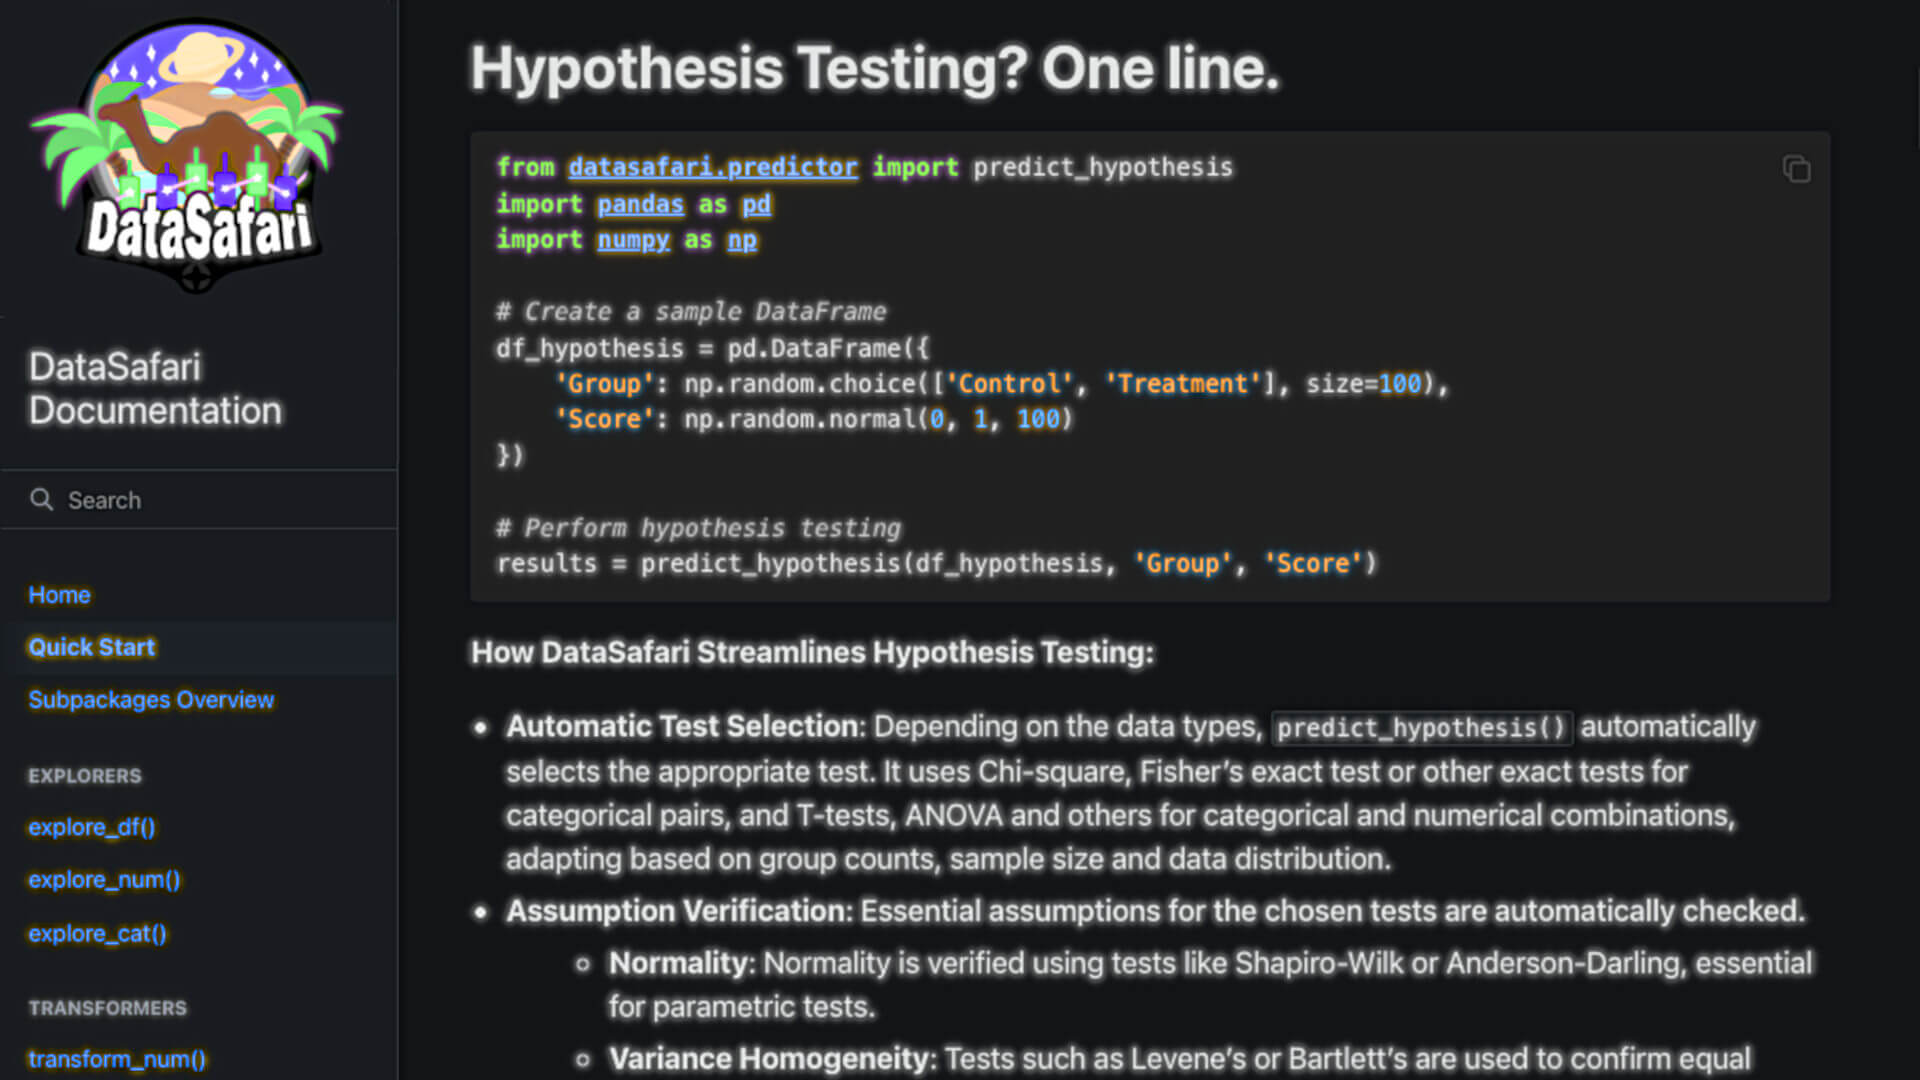
predict_hypothesis() takes a DataFrame, a grouping variable, and a target variable — and autonomously selects and executes the correct statistical test. The function detects variable types, verifies normality and variance homogeneity, chooses between Chi-square, Fisher's exact, t-test, ANOVA, Mann-Whitney, Kruskal-Wallis, and others, then outputs test statistics, p-values, and a plain-language interpretation.
End-to-End ML Pipeline Automation
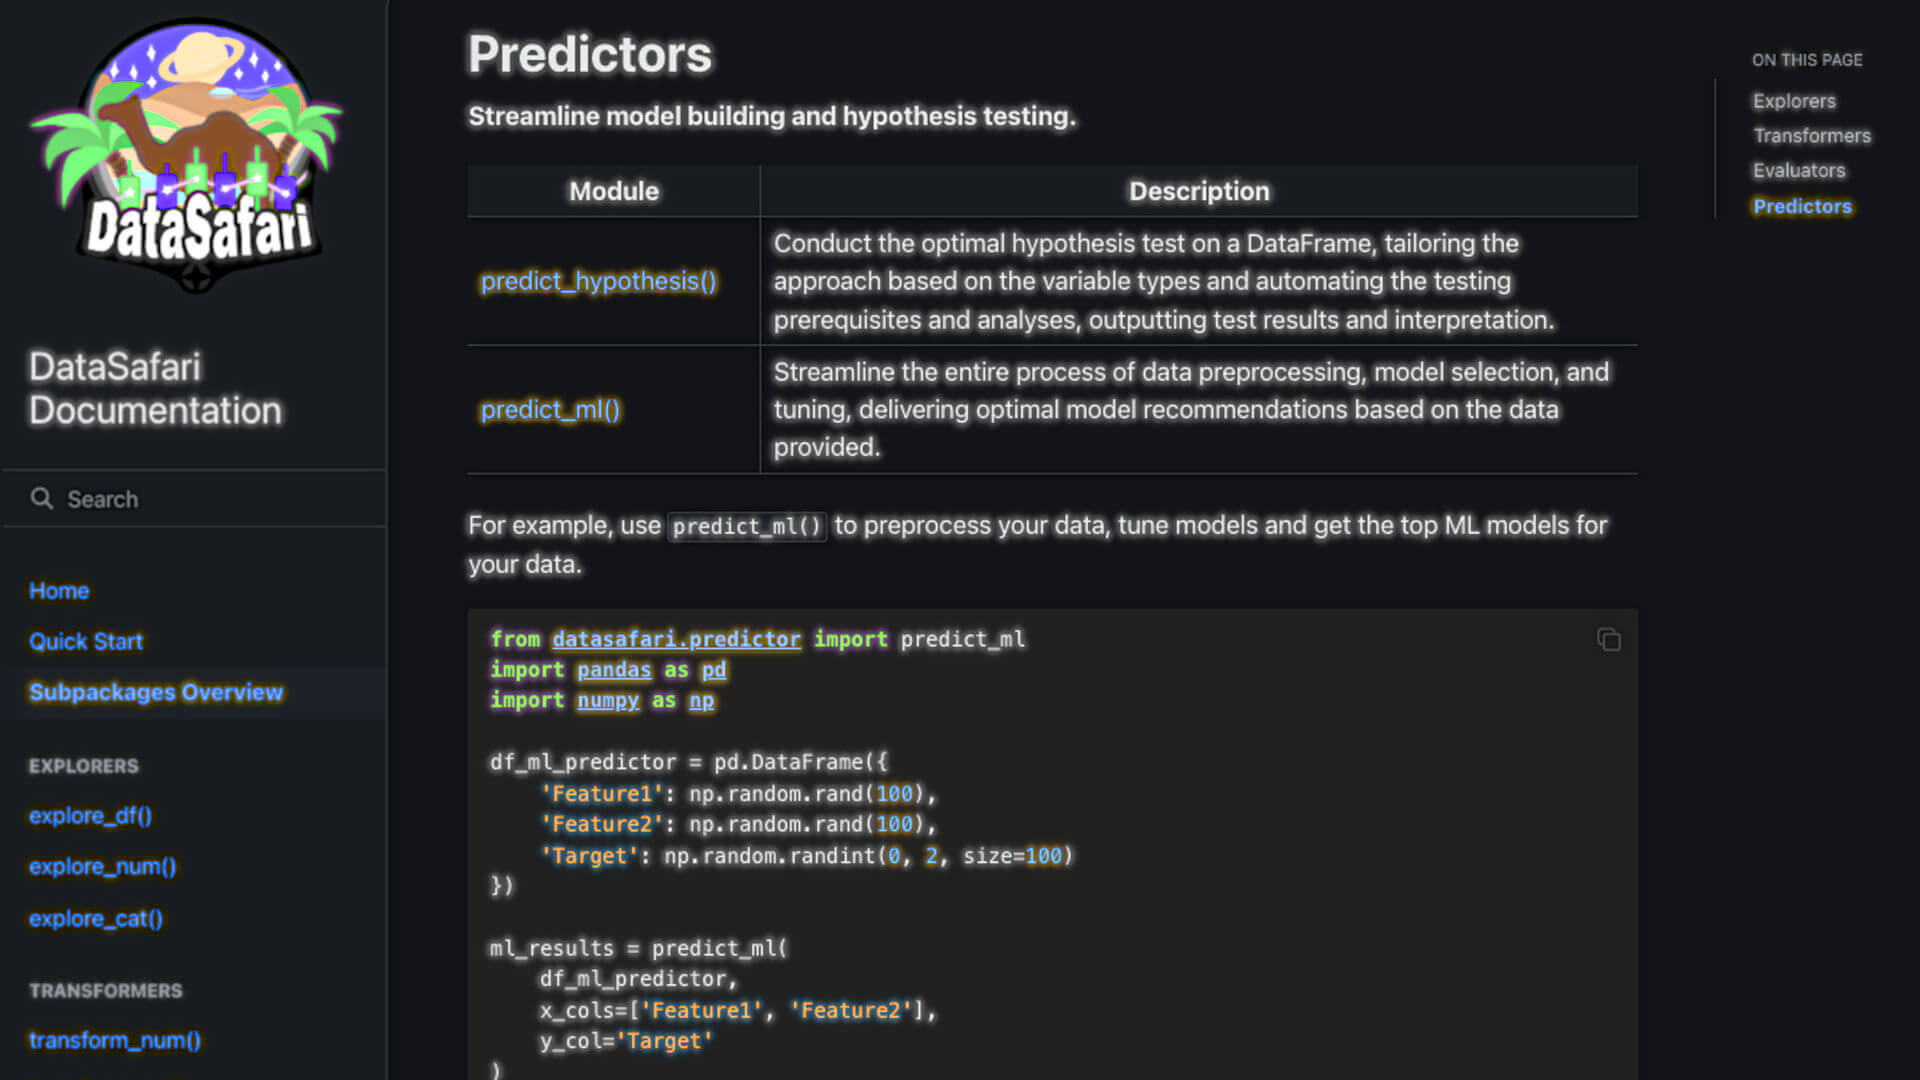
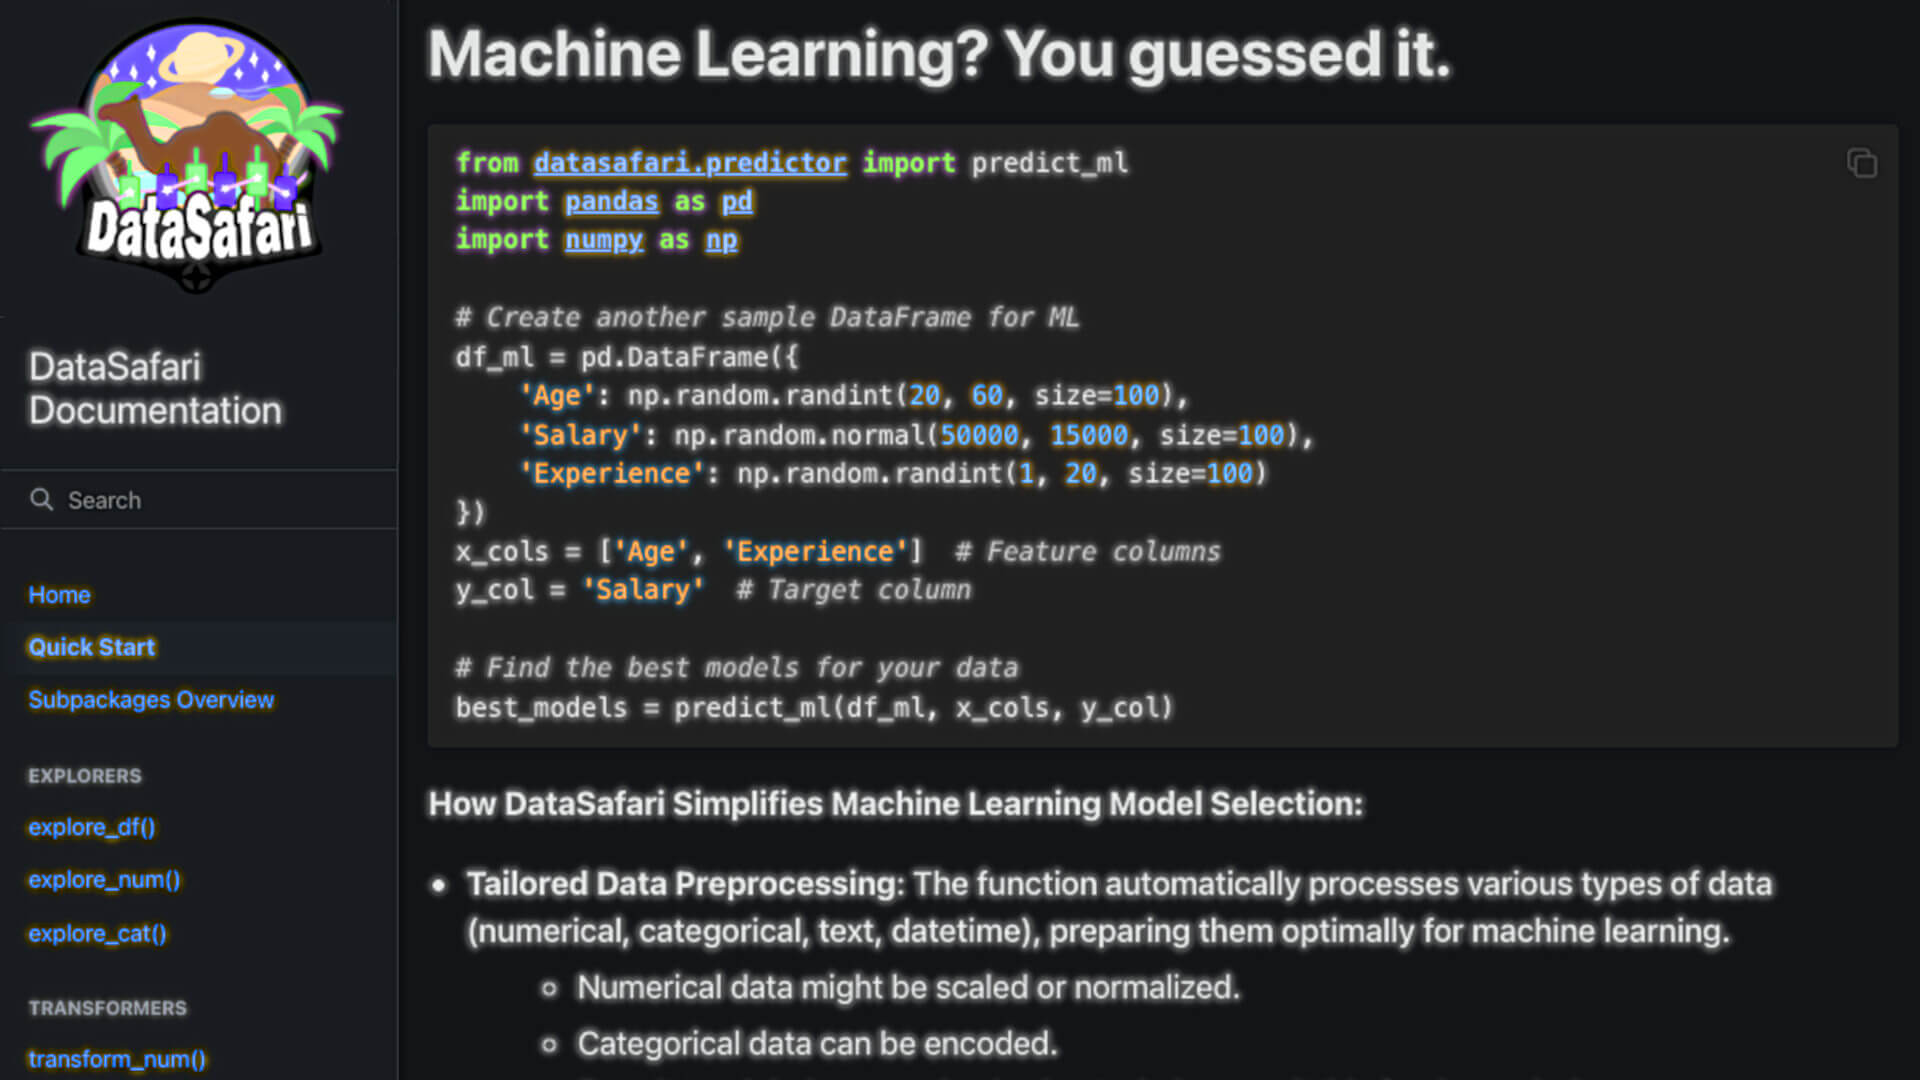
predict_ml() orchestrates the complete machine learning workflow in one call — automatic preprocessing (scaling, encoding, vectorisation), multi-model evaluation using a user-configurable composite score weighted across multiple metrics, and automated hyperparameter tuning via grid search, random search, or Bayesian optimisation. Returns ranked, tuned models with full performance breakdowns.
Data Transformation Engineering
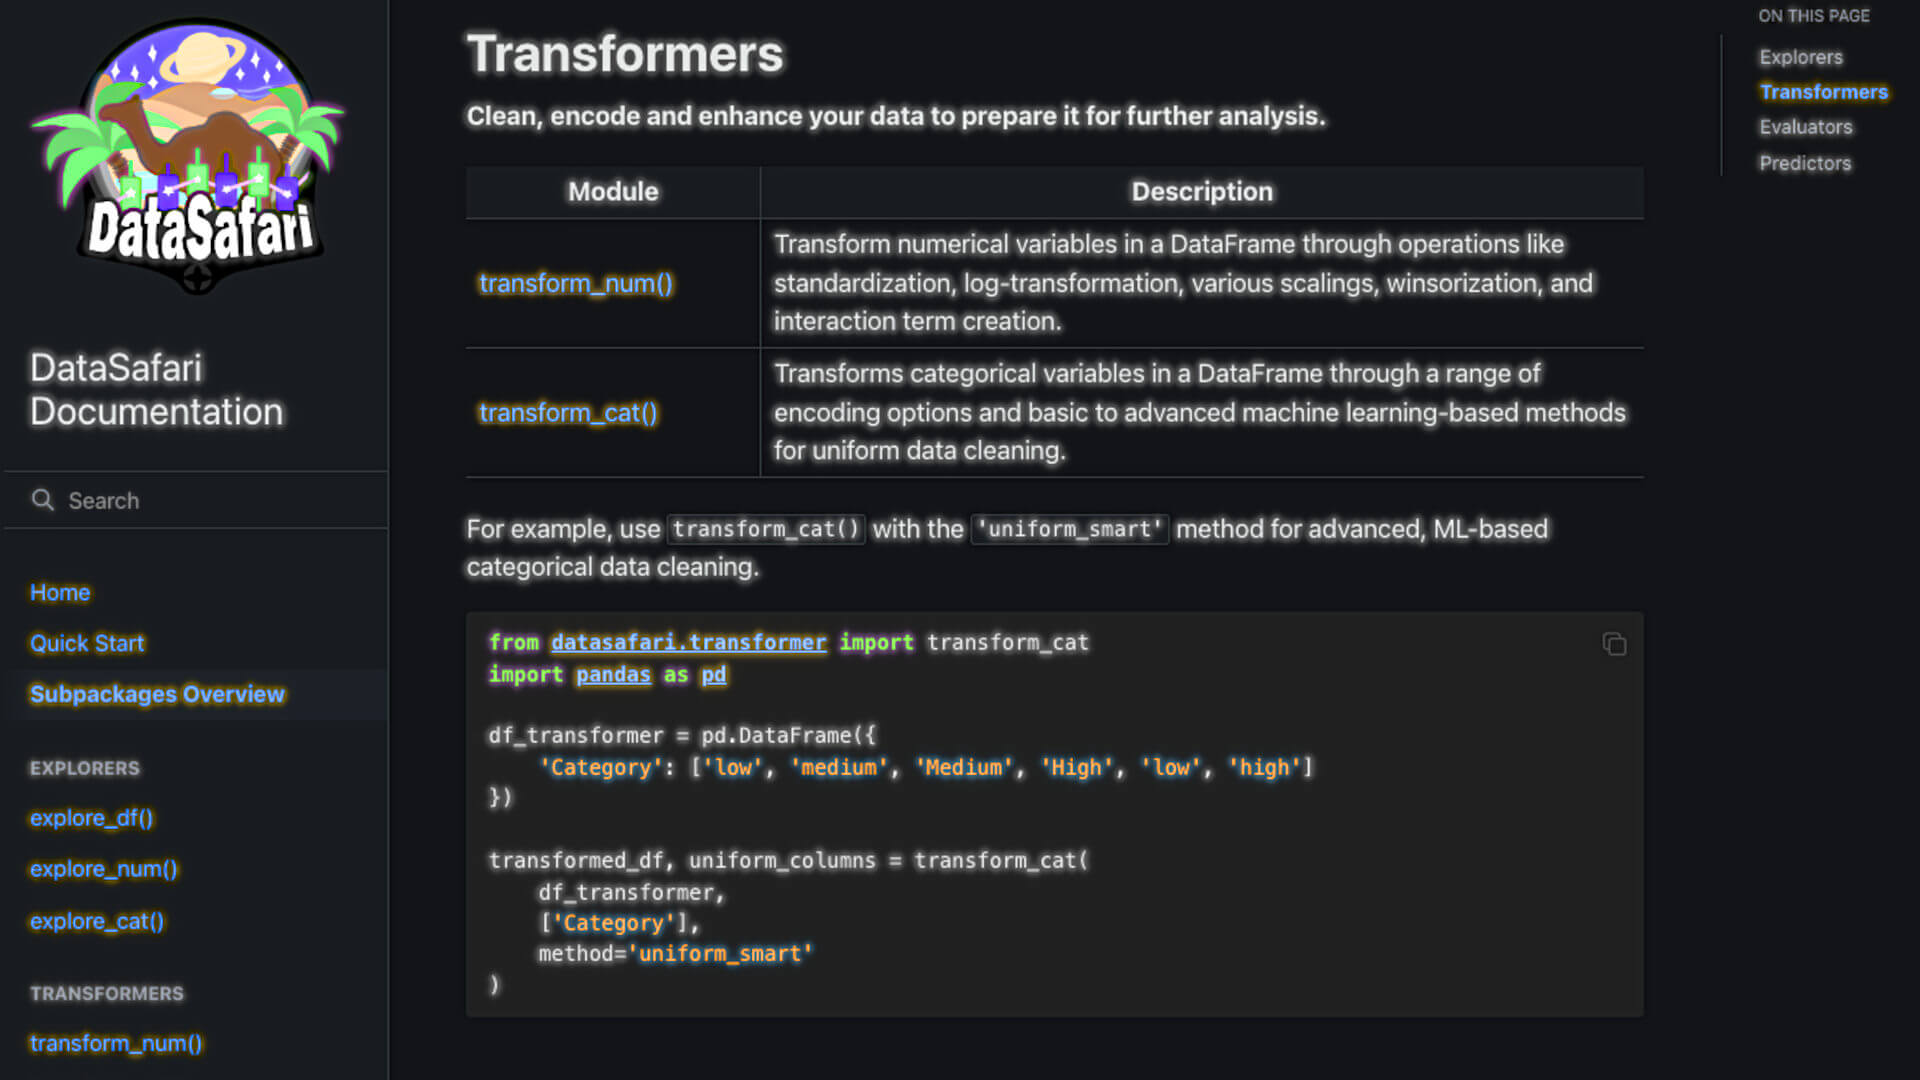
Implemented the Transformers subpackage to handle the full data preparation stage. transform_num() covers standardisation, min-max scaling, log and power transforms, winsorisation, and interaction term creation. transform_cat() handles label encoding, one-hot encoding, target encoding, and ML-based category cleaning — all chainable and parameterised for reproducible pipelines.
Developer API & UX Design
Built datasafari around a deliberate developer experience philosophy — consistent naming across all 11 functions, predictable argument patterns, and sensible defaults that make the library immediately usable without reading the docs. Complex workflows like full ML pipelines and hypothesis testing are exposed as single function calls, hiding implementation complexity behind a clean interface.
Documentation Site Development
Designed and hand-coded datasafari.dev — the public documentation and landing site for the library. Built with custom HTML, CSS, and JavaScript, the site presents the library's philosophy, quick-start guides, and full API reference in a clean, readable format. Integrated with Sphinx and Read the Docs for automated doc generation, while the landing experience was crafted entirely from scratch.
Open-Source Product Lifecycle Management
Managed datasafari as a solo product owner, from its initial concept and roadmap through versioned releases, issue tracking, and ongoing maintenance. Closed 136 issues while balancing engineering quality, user-facing documentation, and public discoverability. Built systems that kept the project sustainable and reproducible beyond any single release.
Brand Identity & Visual Systems
Created the complete visual identity for datasafari, including the logo, banner artwork, icon set, and graphic assets used across GitHub, PyPI, and the documentation site. Designed every visual touchpoint a user encounters when discovering the library, giving an independent open-source project a coherent, professional brand from day one.
CI/CD Pipeline Architecture
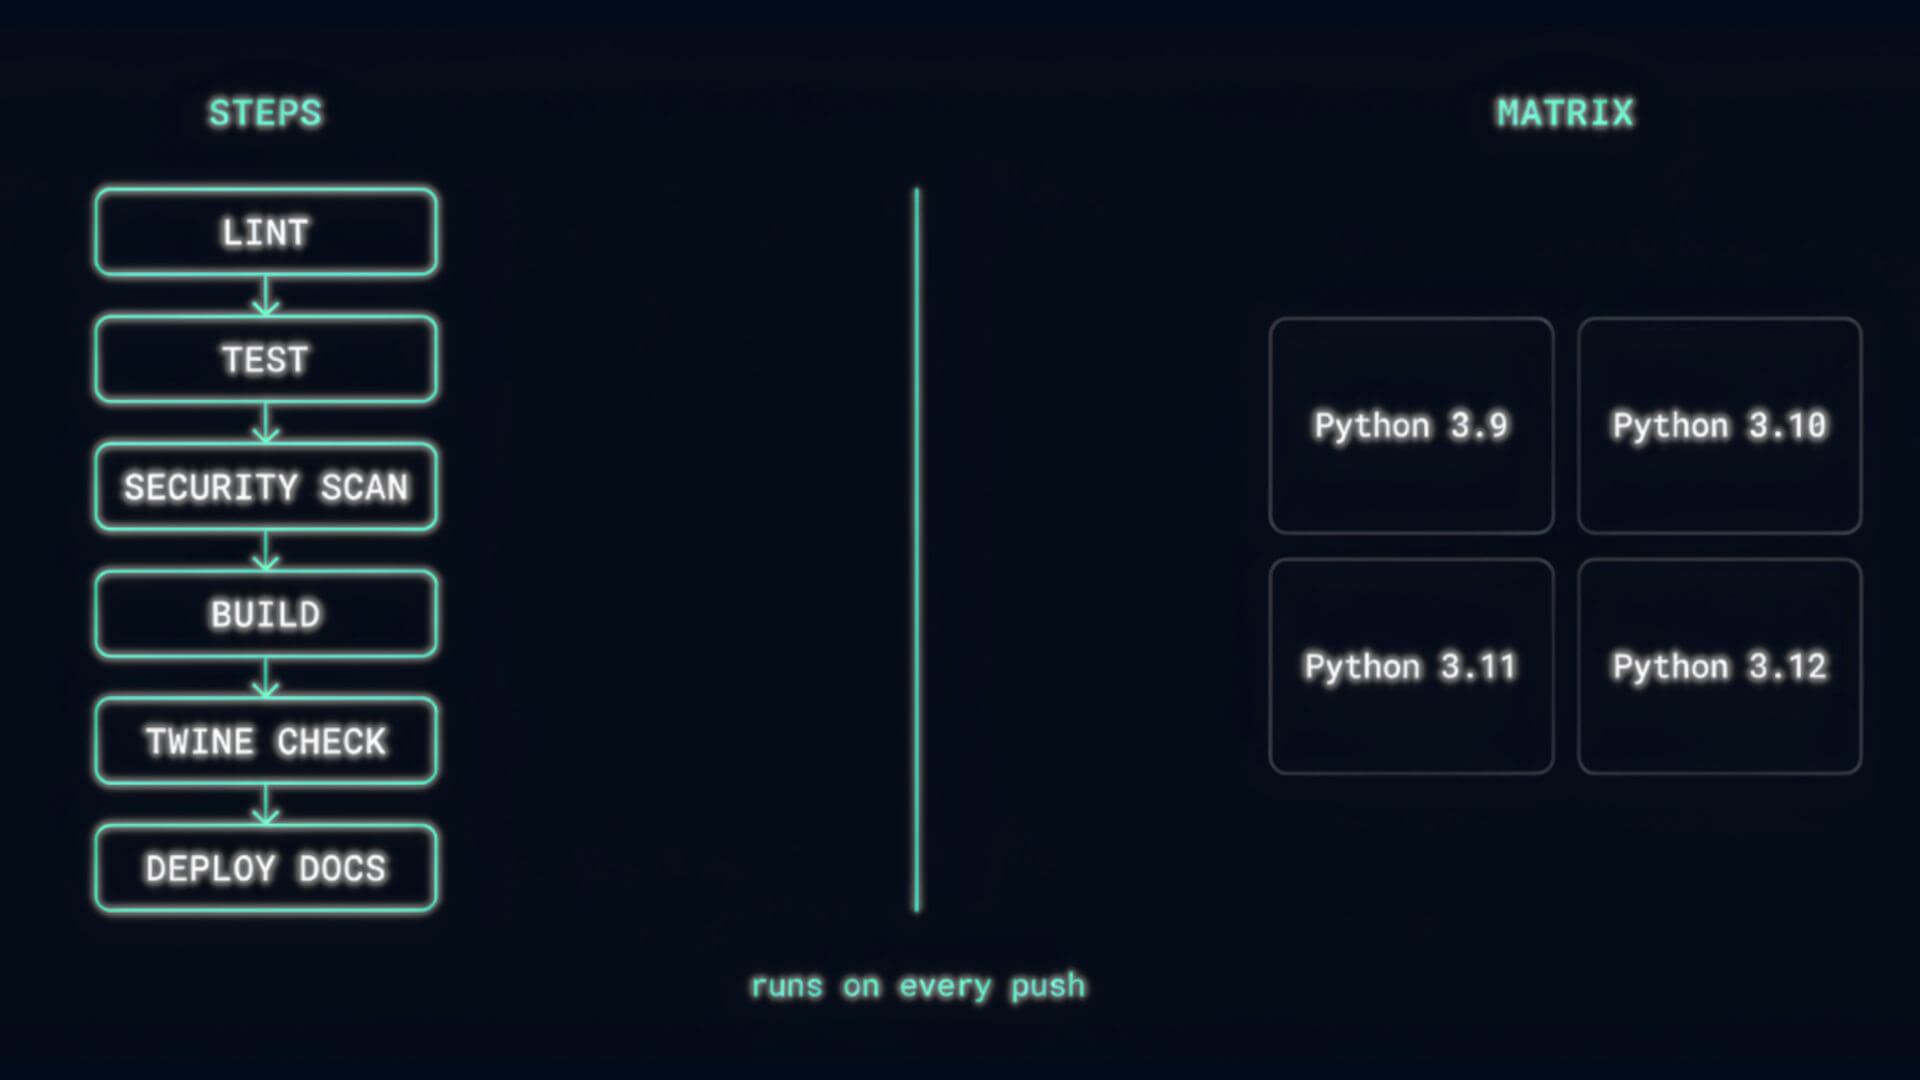
- Built a 12-step GitHub Actions pipeline covering linting, the test matrix, security scanning, and conditional PyPI publishing on tagged releases
- Configured tox to run the full pytest suite in parallel across Python 3.9, 3.10, 3.11, and 3.12 on every push
- Automated Sphinx docs build and live deployment to datasafari.dev via rsync over SSH, triggered on every merge to main
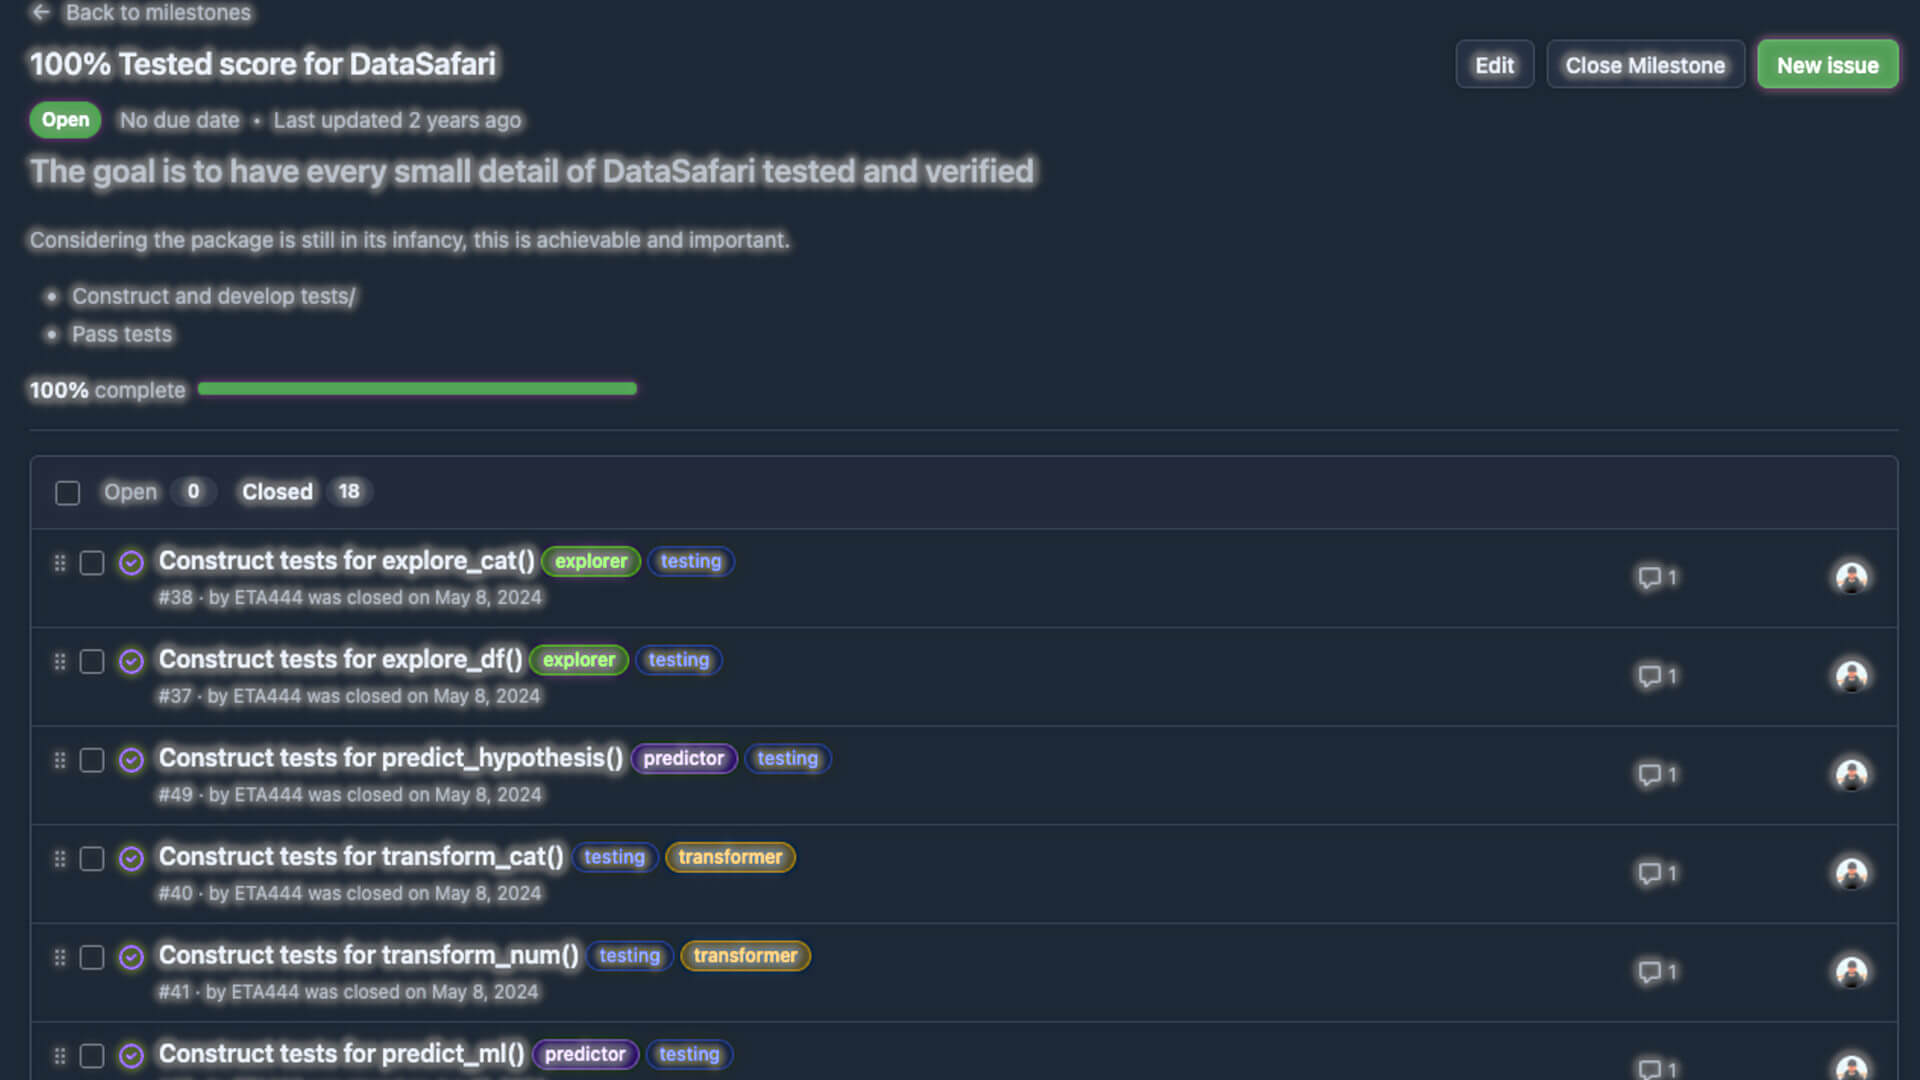
- Closed 136 GitHub issues over the development lifecycle, each fix validated through the pipeline before merge
Issue Tracking & Milestone System
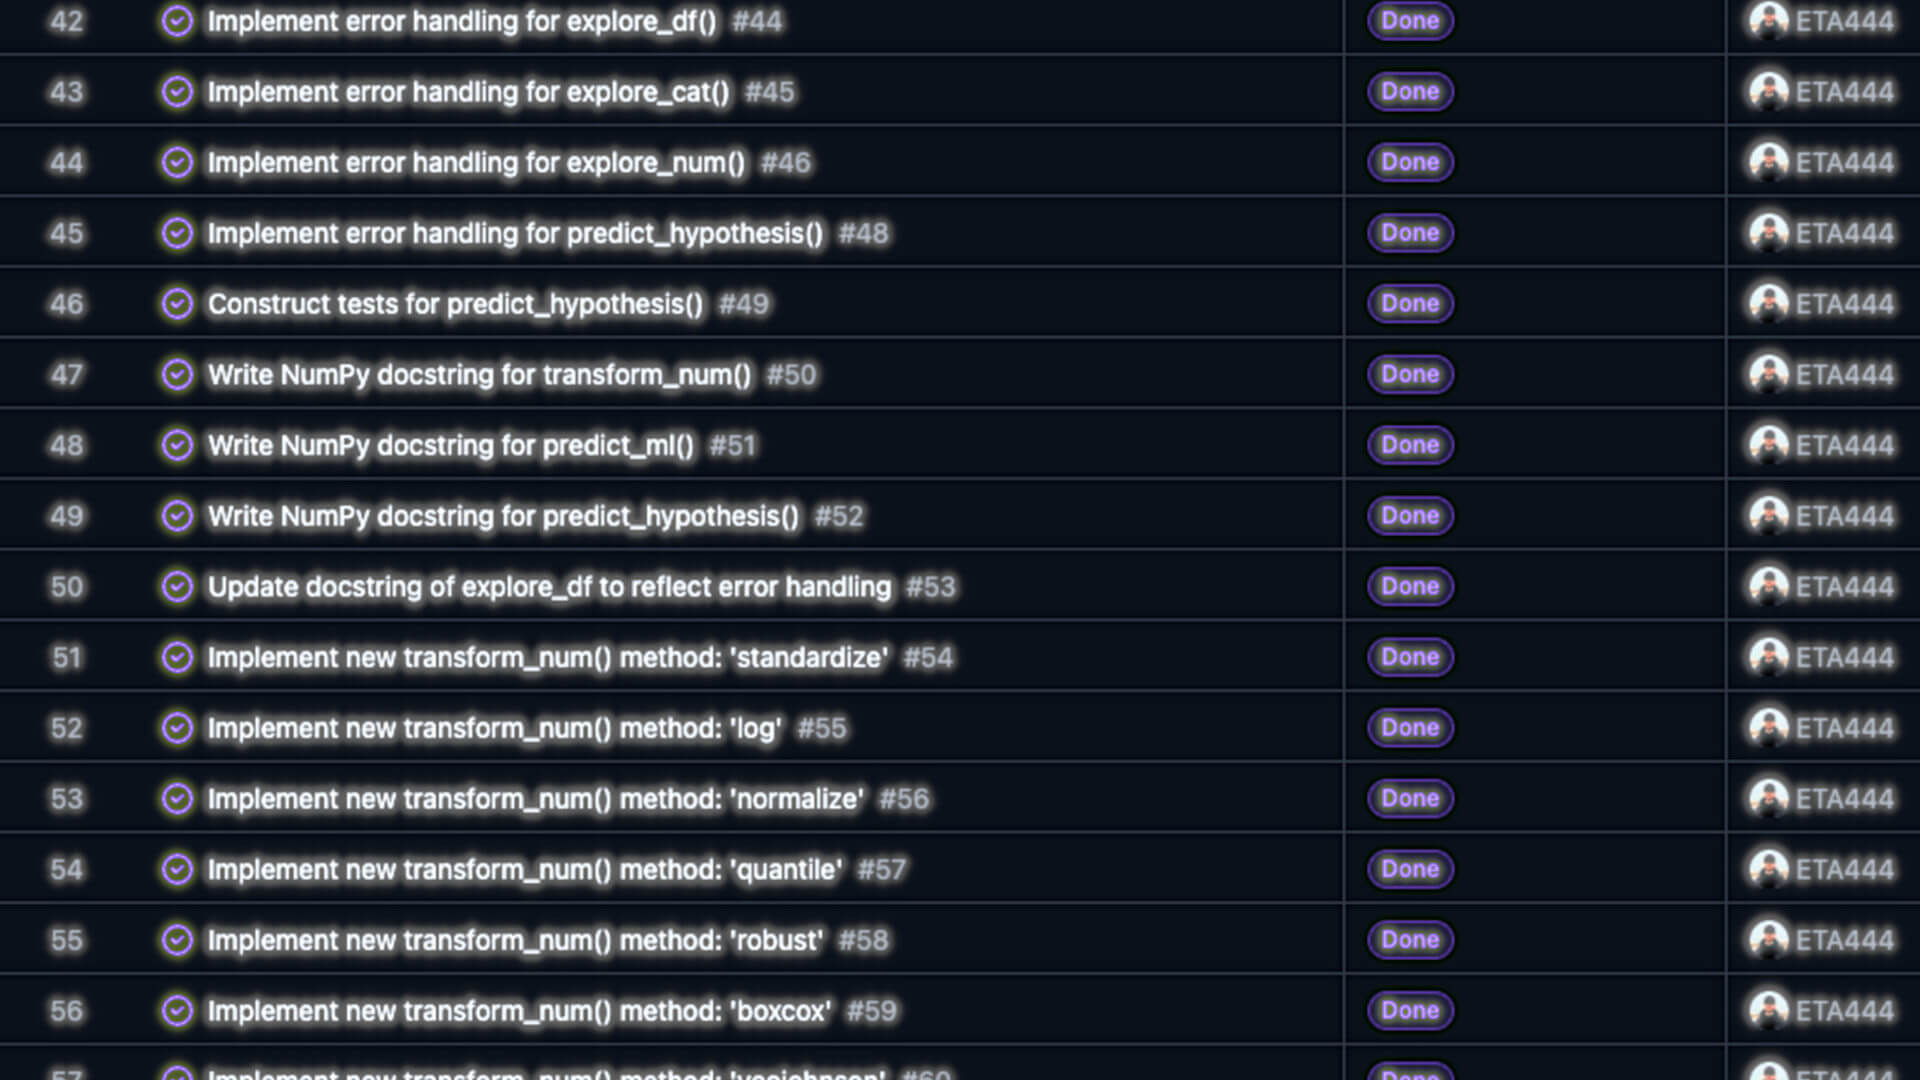
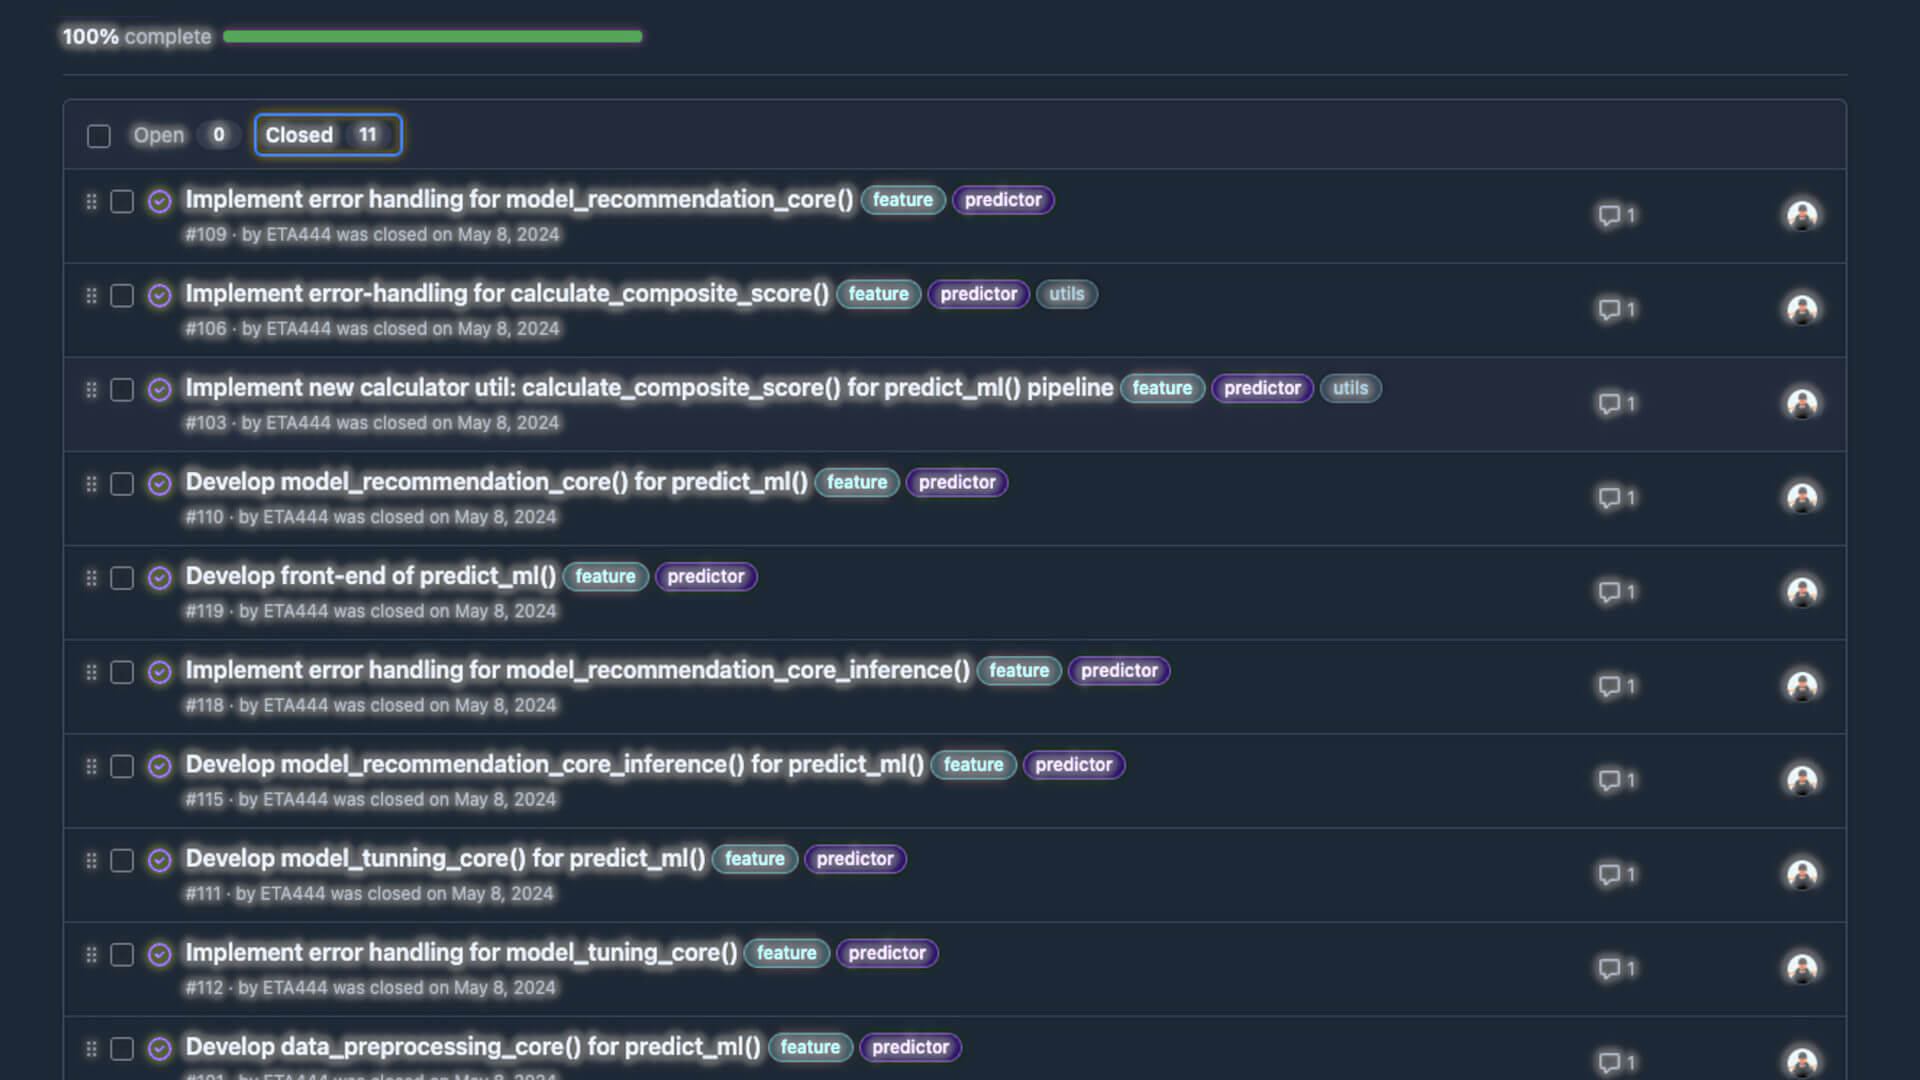
- Filed and closed 136 GitHub issues across the full development lifecycle — each with a structured problem description, reproduction context, and a written solution note on close
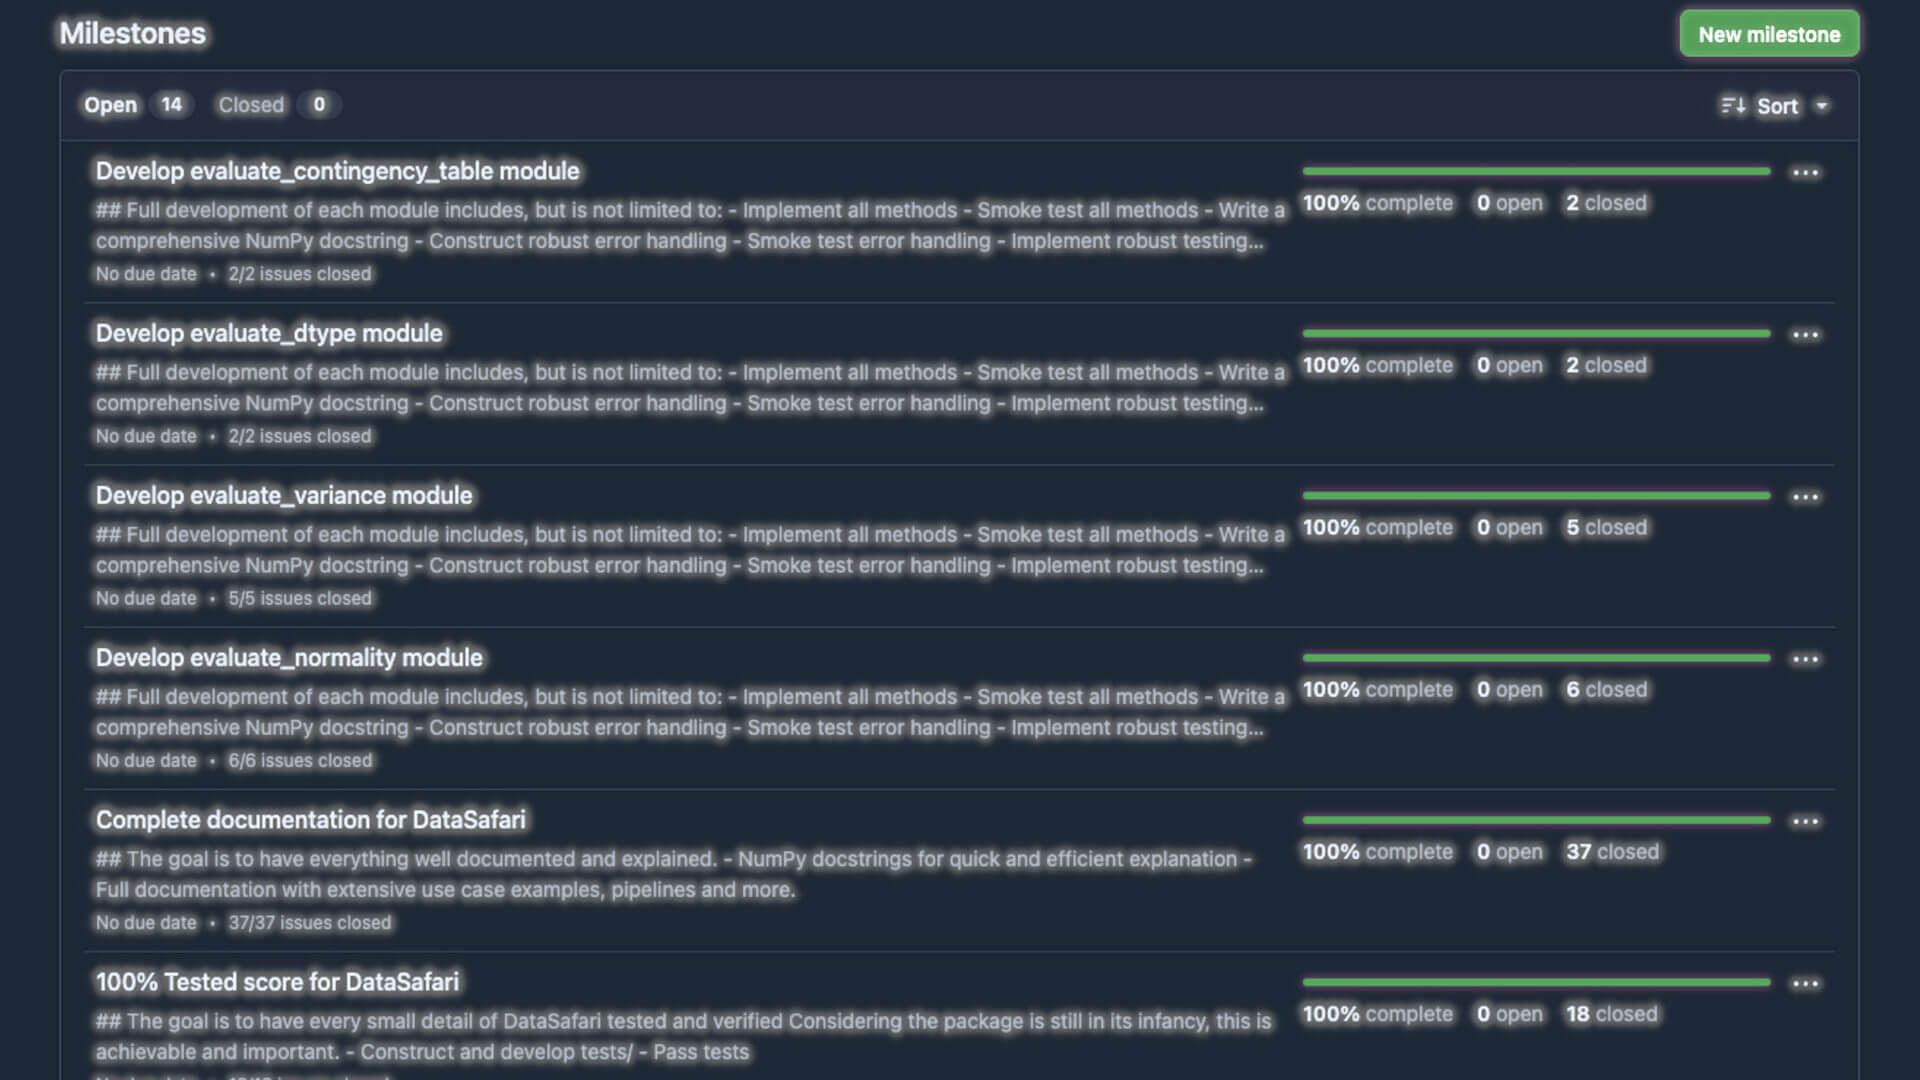
- Organised work into versioned milestones mapping issues to release targets, giving every fix a traceable path from report to merged commit
- Built a full label taxonomy — bug type, domain, priority, and status — so the issue board reads as a professional engineering backlog, not a personal to-do list
Test Suite & Quality Gates
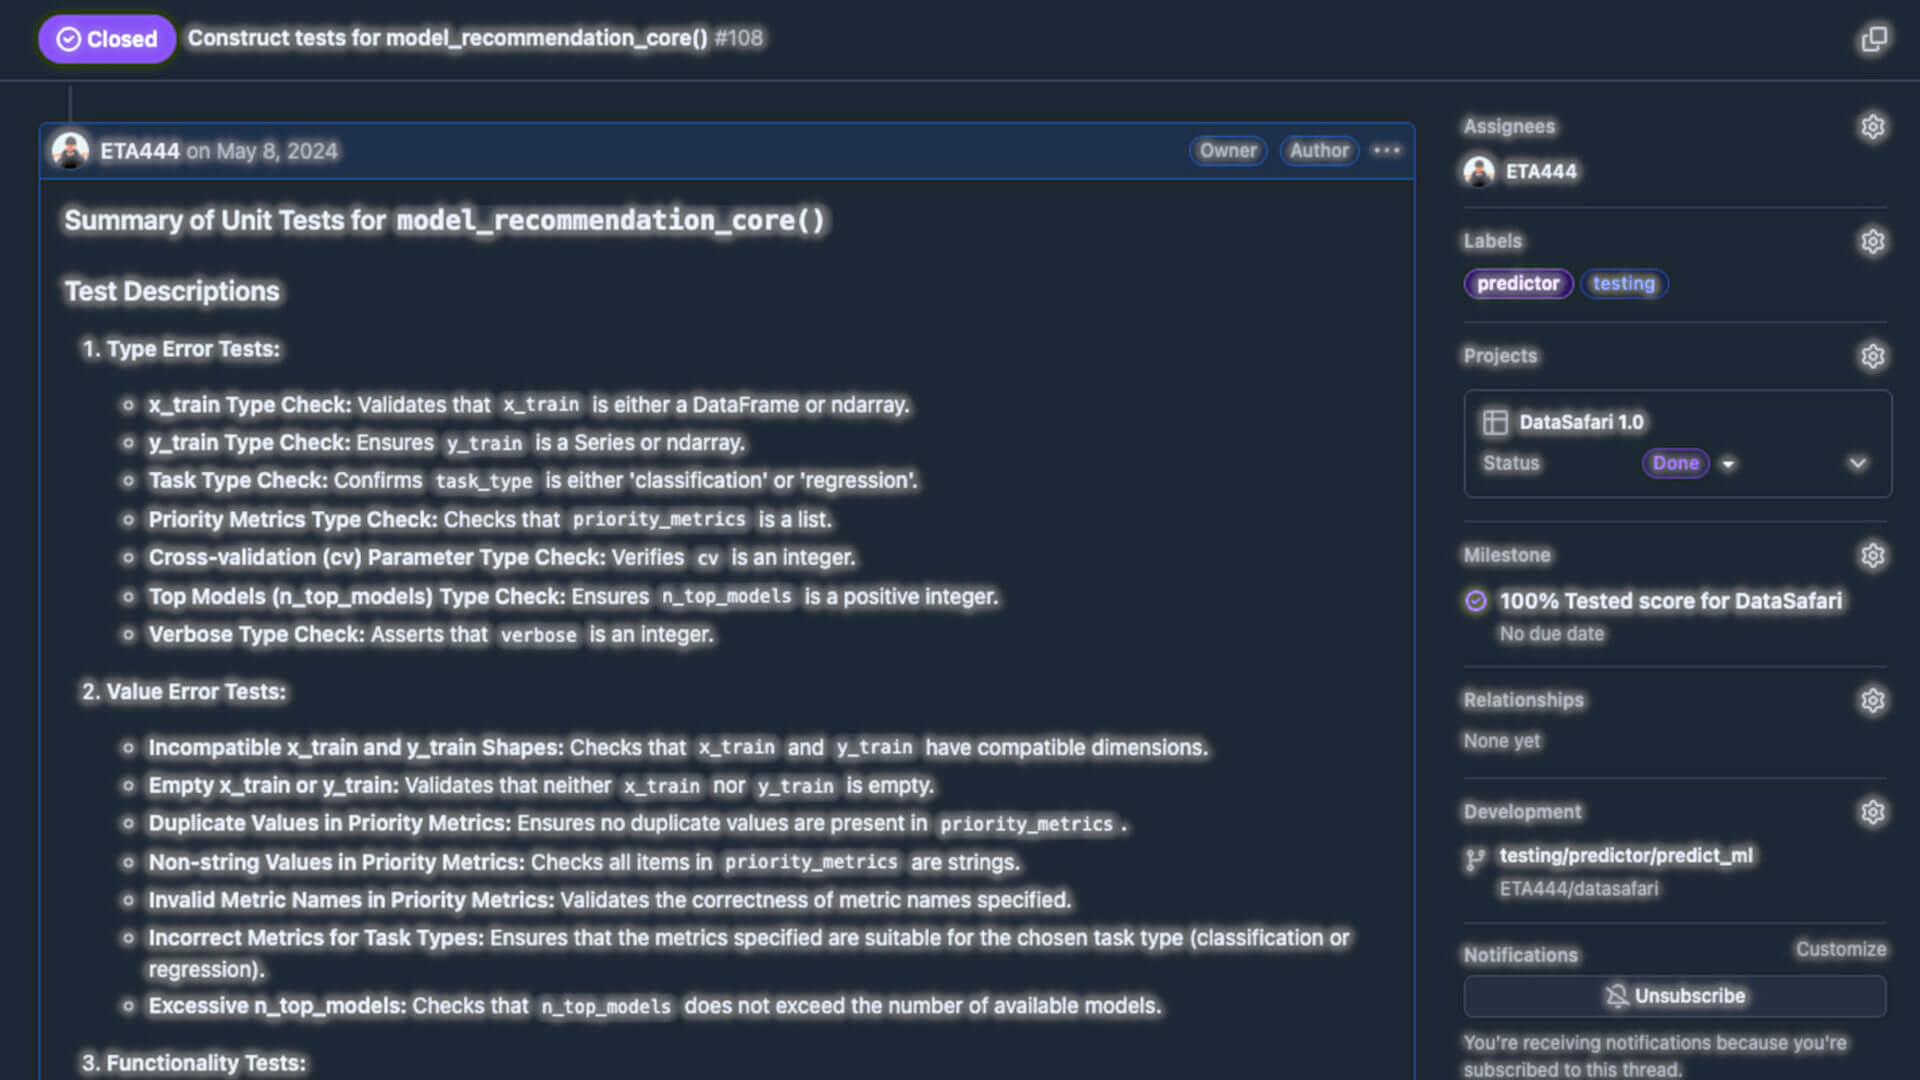
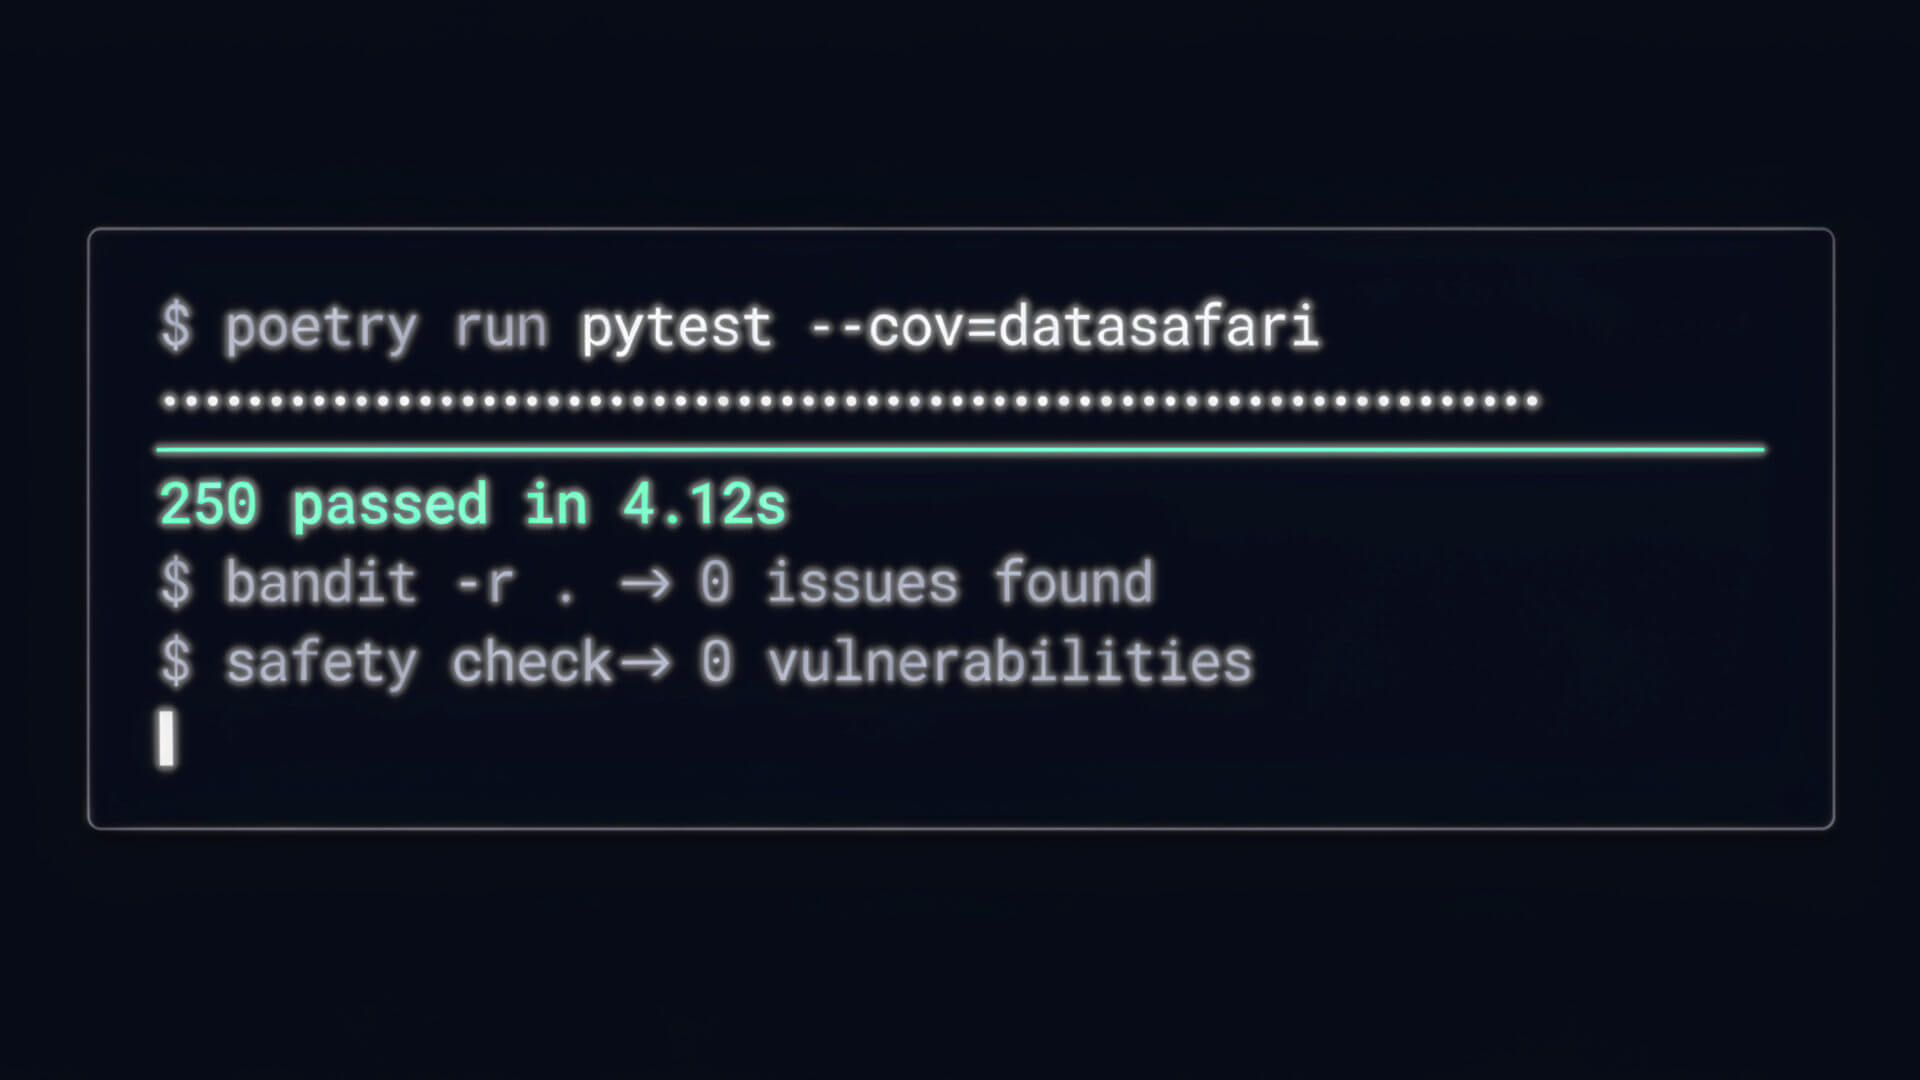
- Wrote 250+ pytest tests across 11 test files, covering edge cases, input validation, and statistical output correctness for all four subpackages
- Integrated Bandit for static security scanning and SafetyCLI for dependency vulnerability auditing — both run automatically on every push
- Configured tox to enforce test-passing across all supported Python versions before any release is tagged
4-Subpackage Library Architecture
- Designed the full package structure from scratch:
explorer/,transformer/,evaluator/,predictor/— each a self-contained module with its own public API surface - Every public function follows a consistent interface contract: DataFrame in, structured report out — one-liner by design, full depth available via parameters
- Configured Poetry, Setuptools, and
pyproject.tomlfor reproducible builds and one-command PyPI distribution
Automated EDA — explore_num()
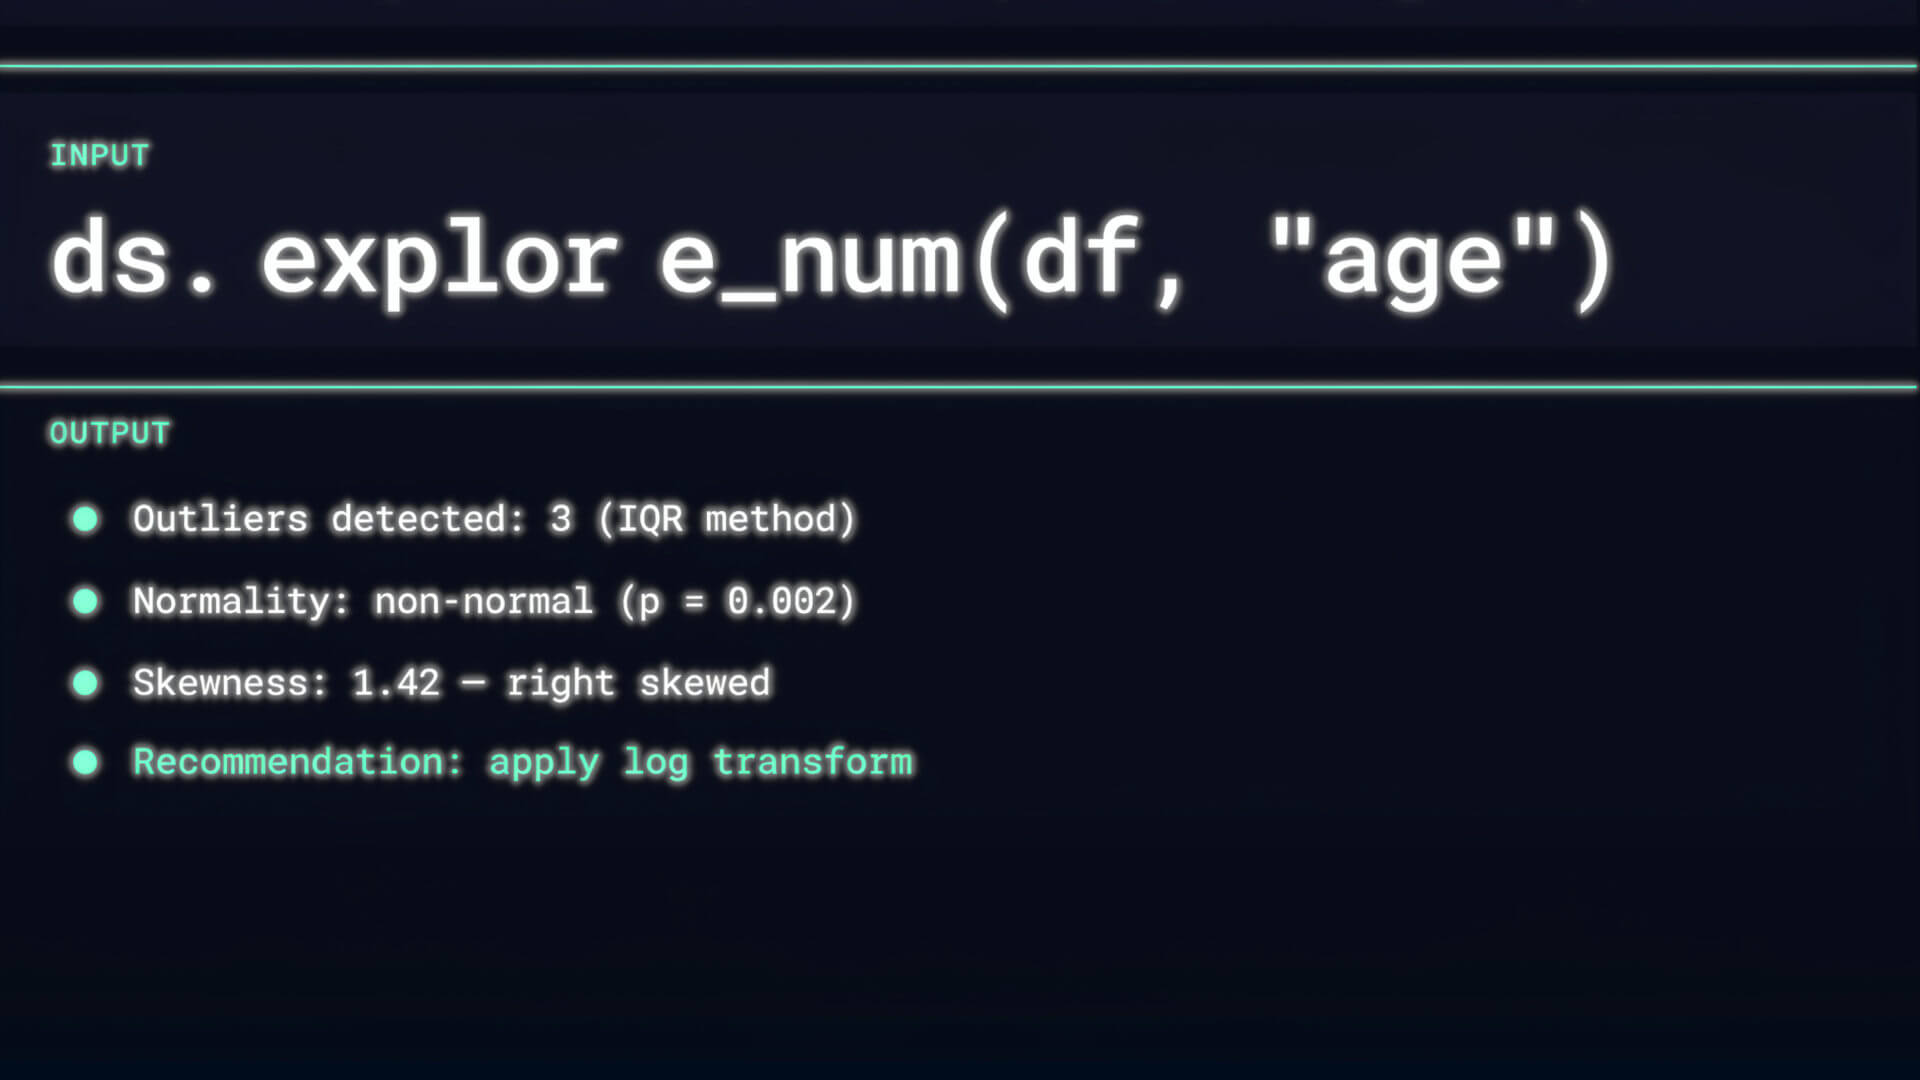
- Single function call produces full numerical profiling: outlier detection via Z-score, IQR, and Mahalanobis distance, normality testing, skewness, kurtosis, and multicollinearity
- Output is a structured plain-English report with findings and actionable recommendations — not raw numbers
- Automatically selects the correct statistical method based on sample size and data characteristics at runtime
End-to-End ML Pipeline — predict_ml()
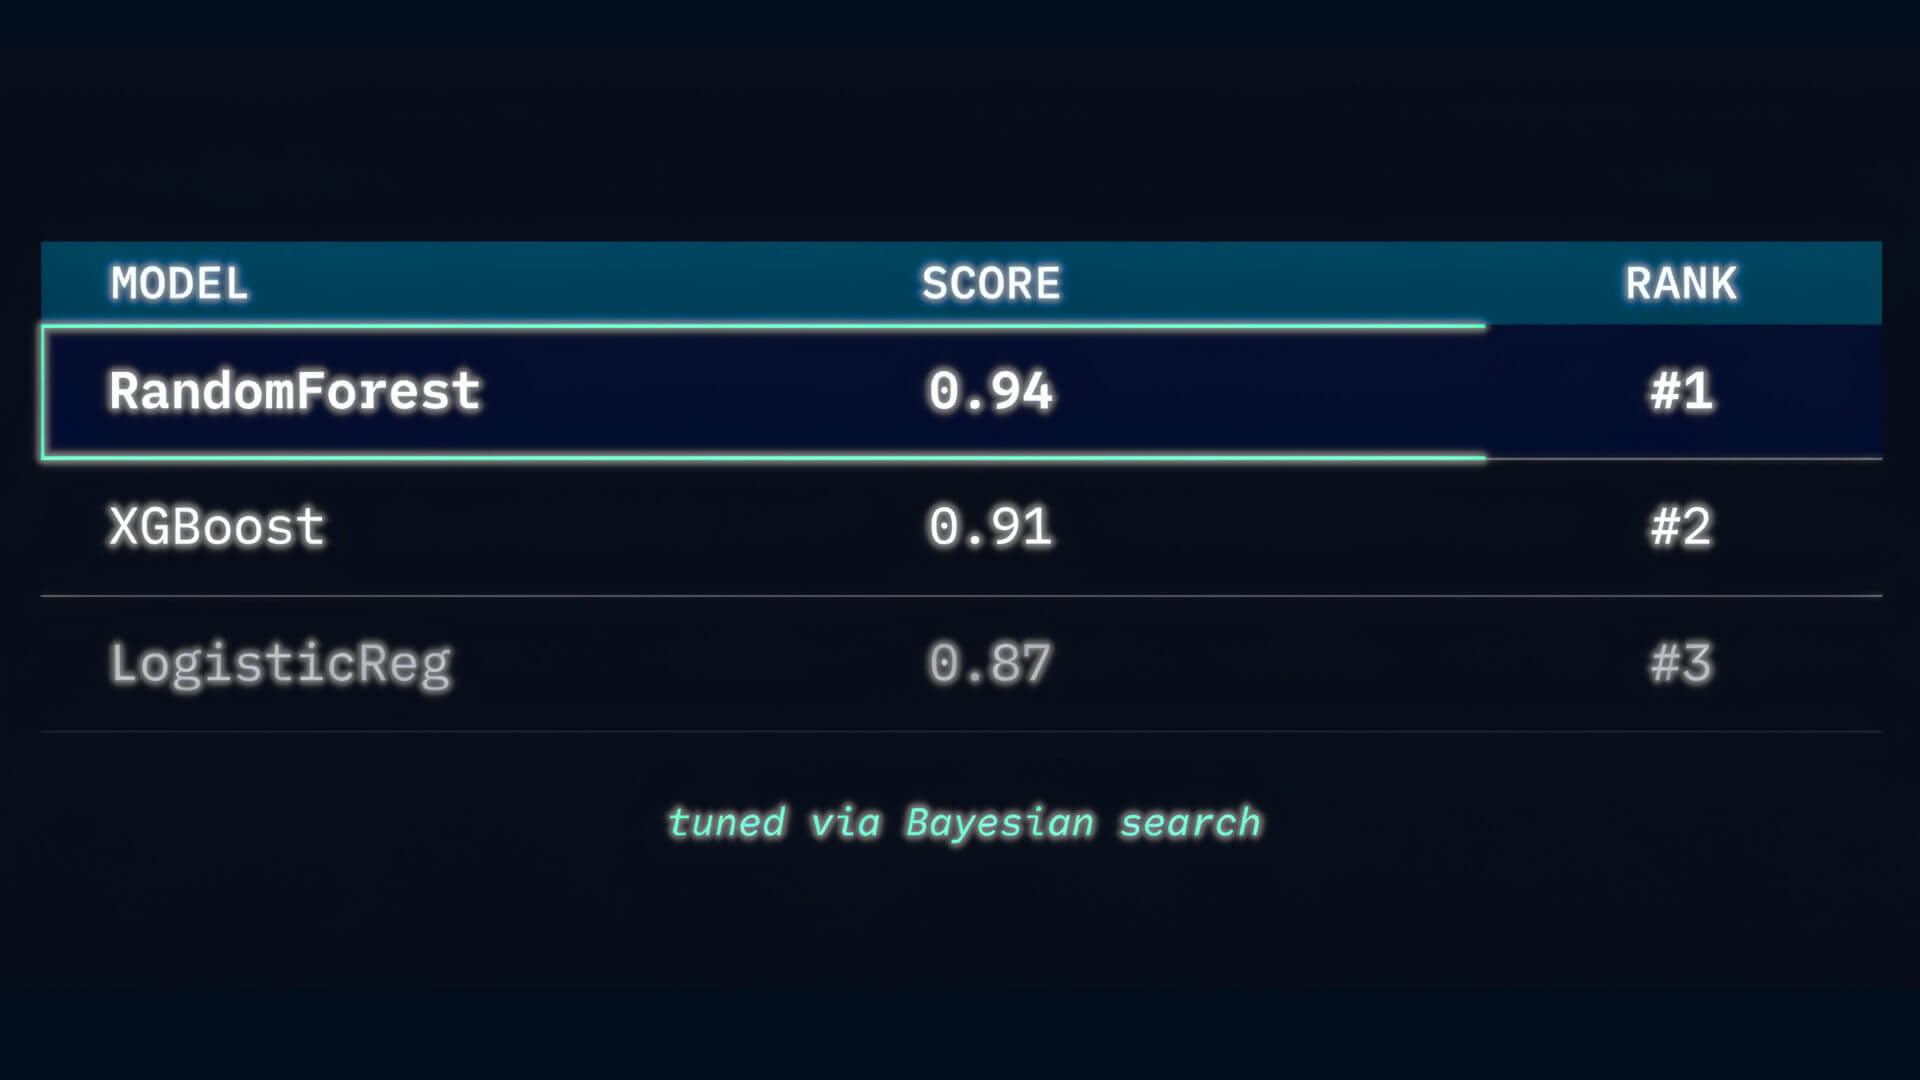
- One call handles preprocessing, multi-model training, composite-score-based evaluation weighted across user-configurable metrics, and ranked output
- Automated hyperparameter tuning via grid search, random search, or Bayesian optimisation — user selects strategy, library handles execution
- 10 pipeline decisions automated per ML run: encoding, scaling, model selection, tuning strategy, evaluation weighting, and recommendation generation
Website & Documentation
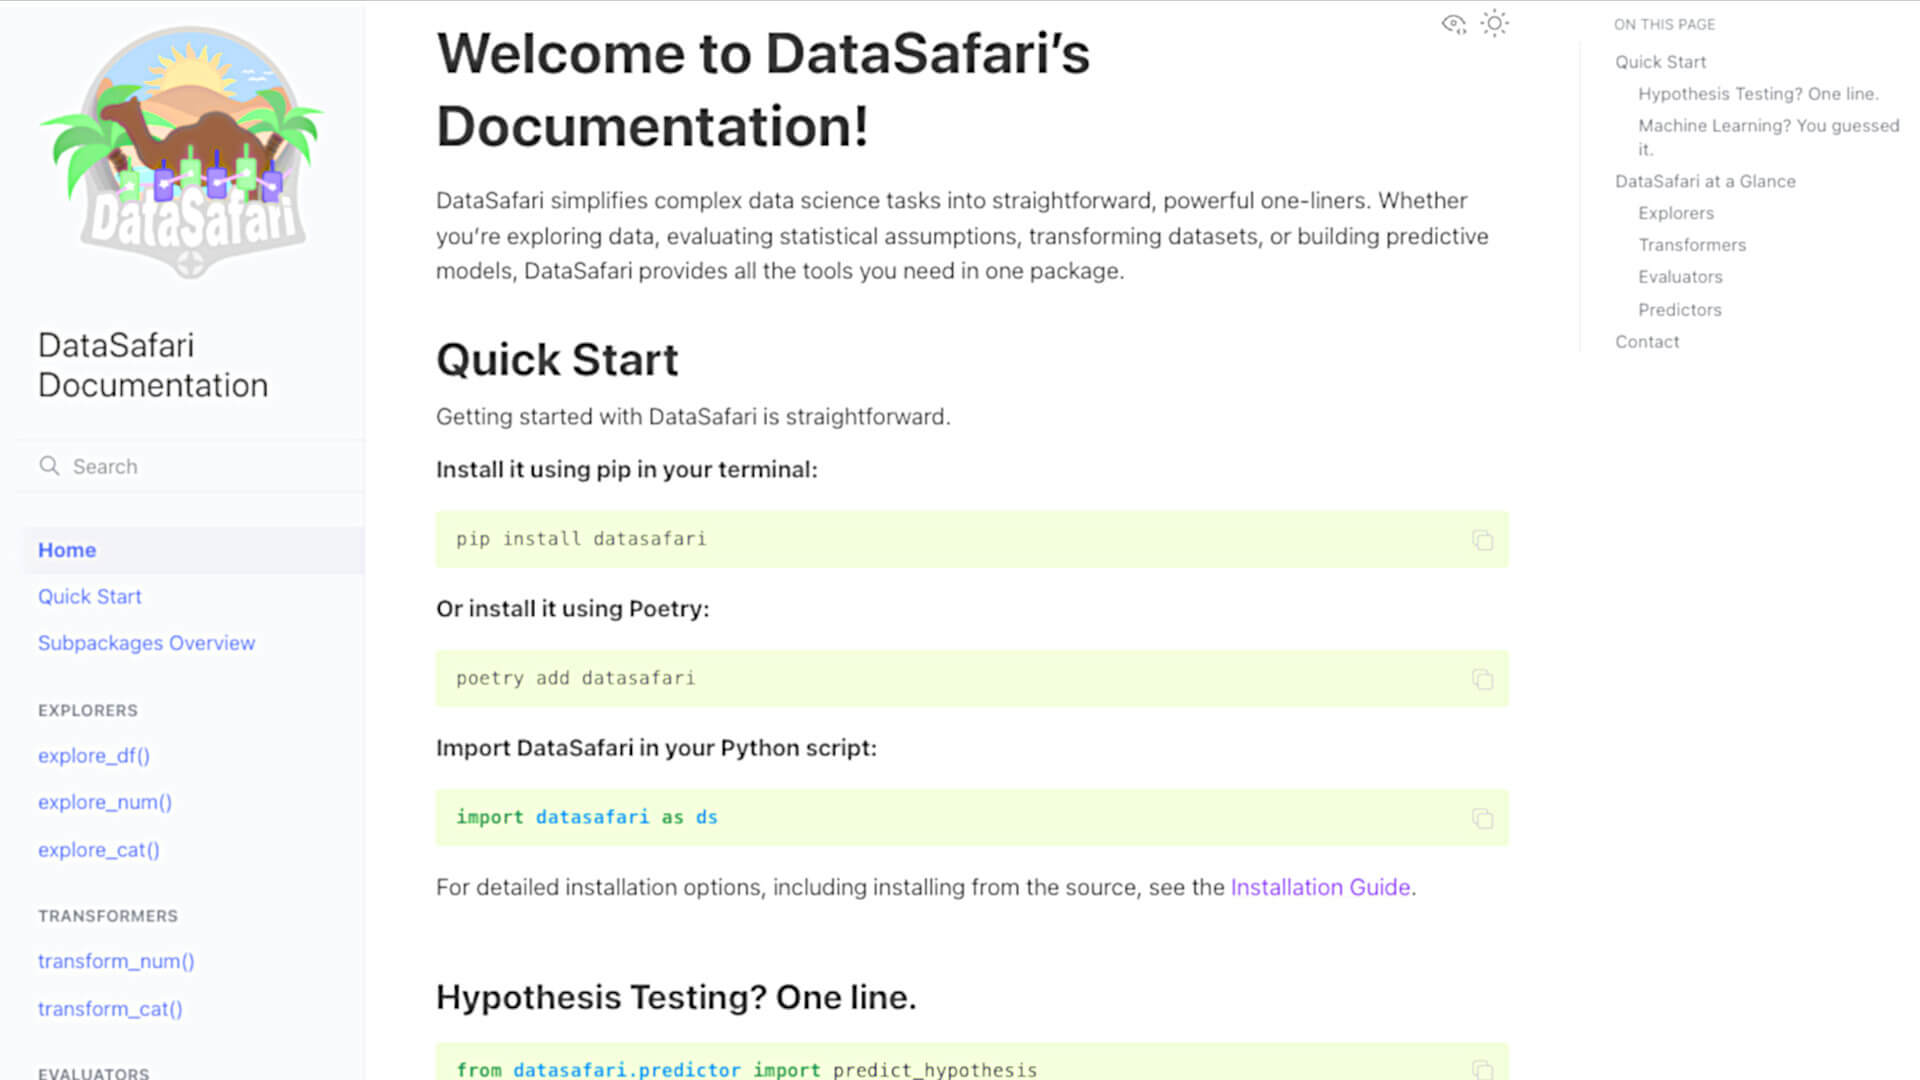
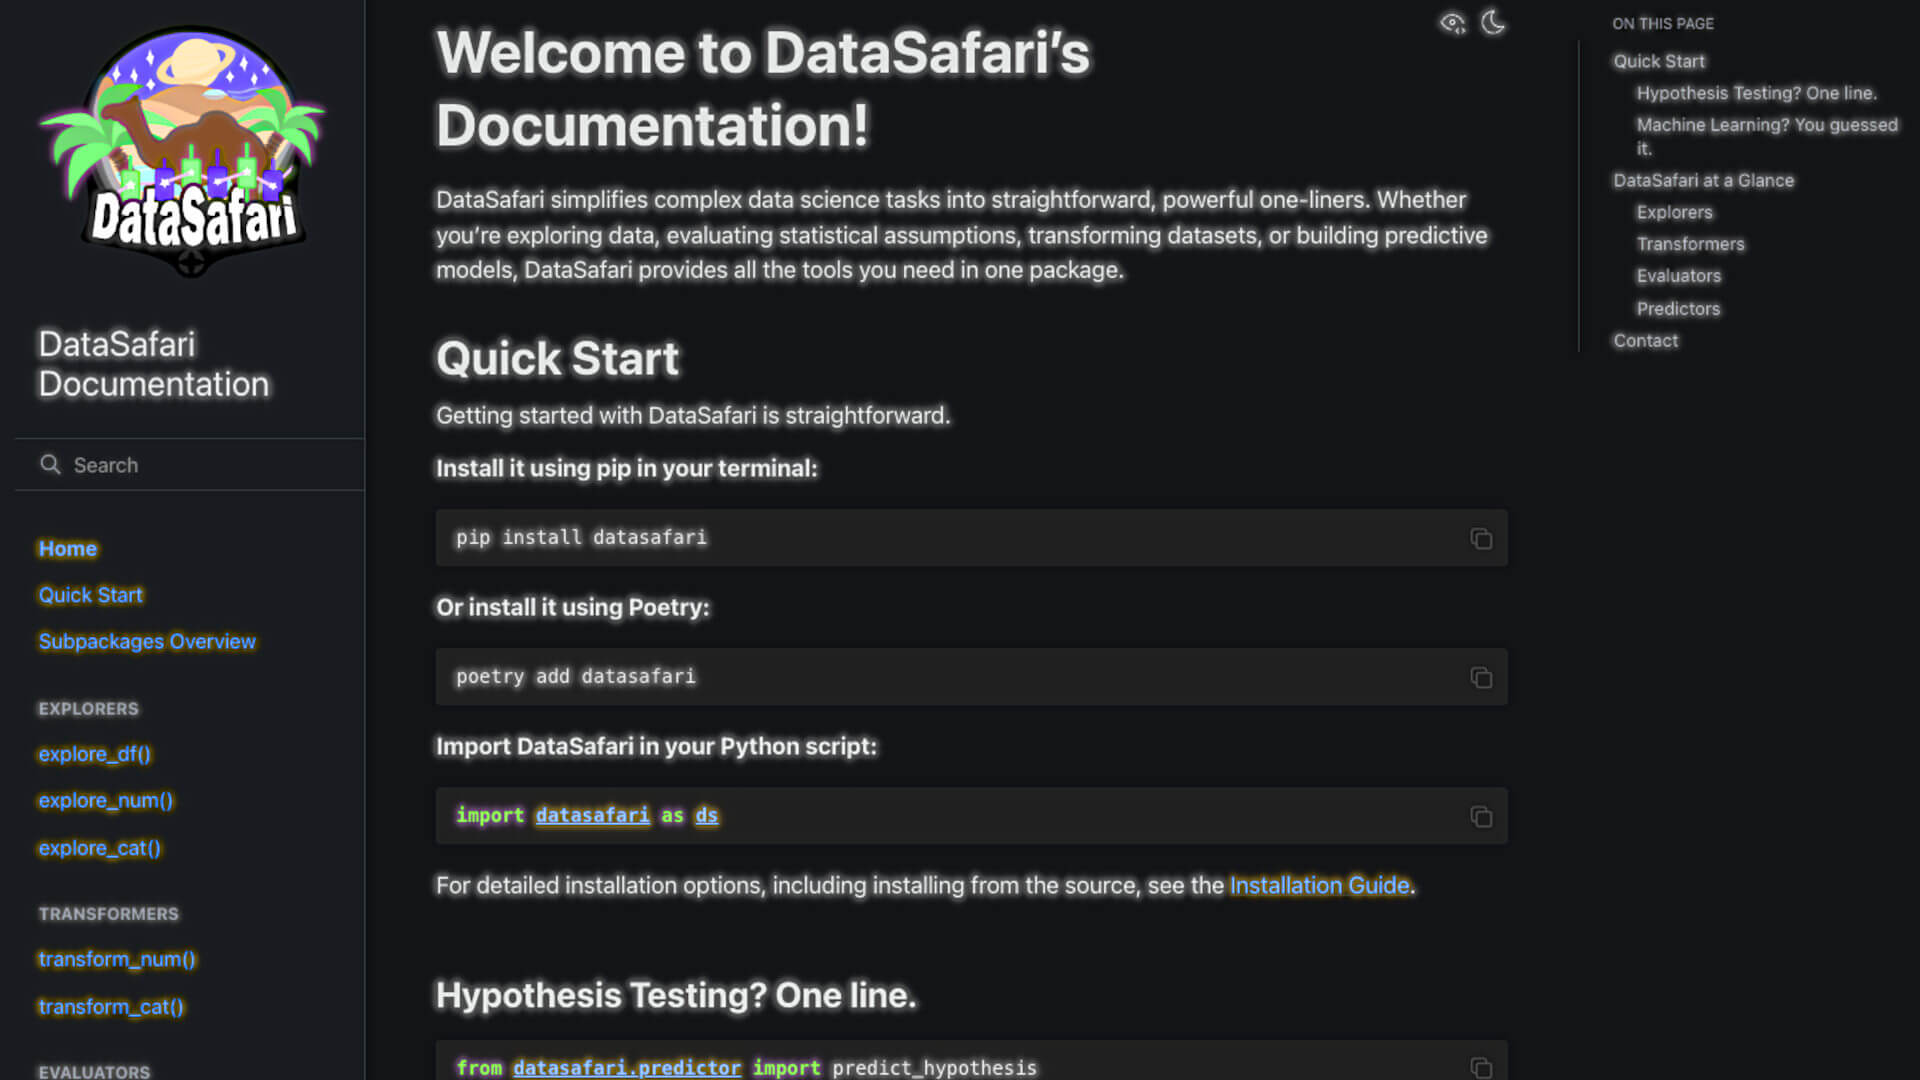
- Hand-coded the full landing site at datasafari.dev — custom HTML, CSS, and JavaScript, designed from scratch to communicate the library's philosophy and quick-start path
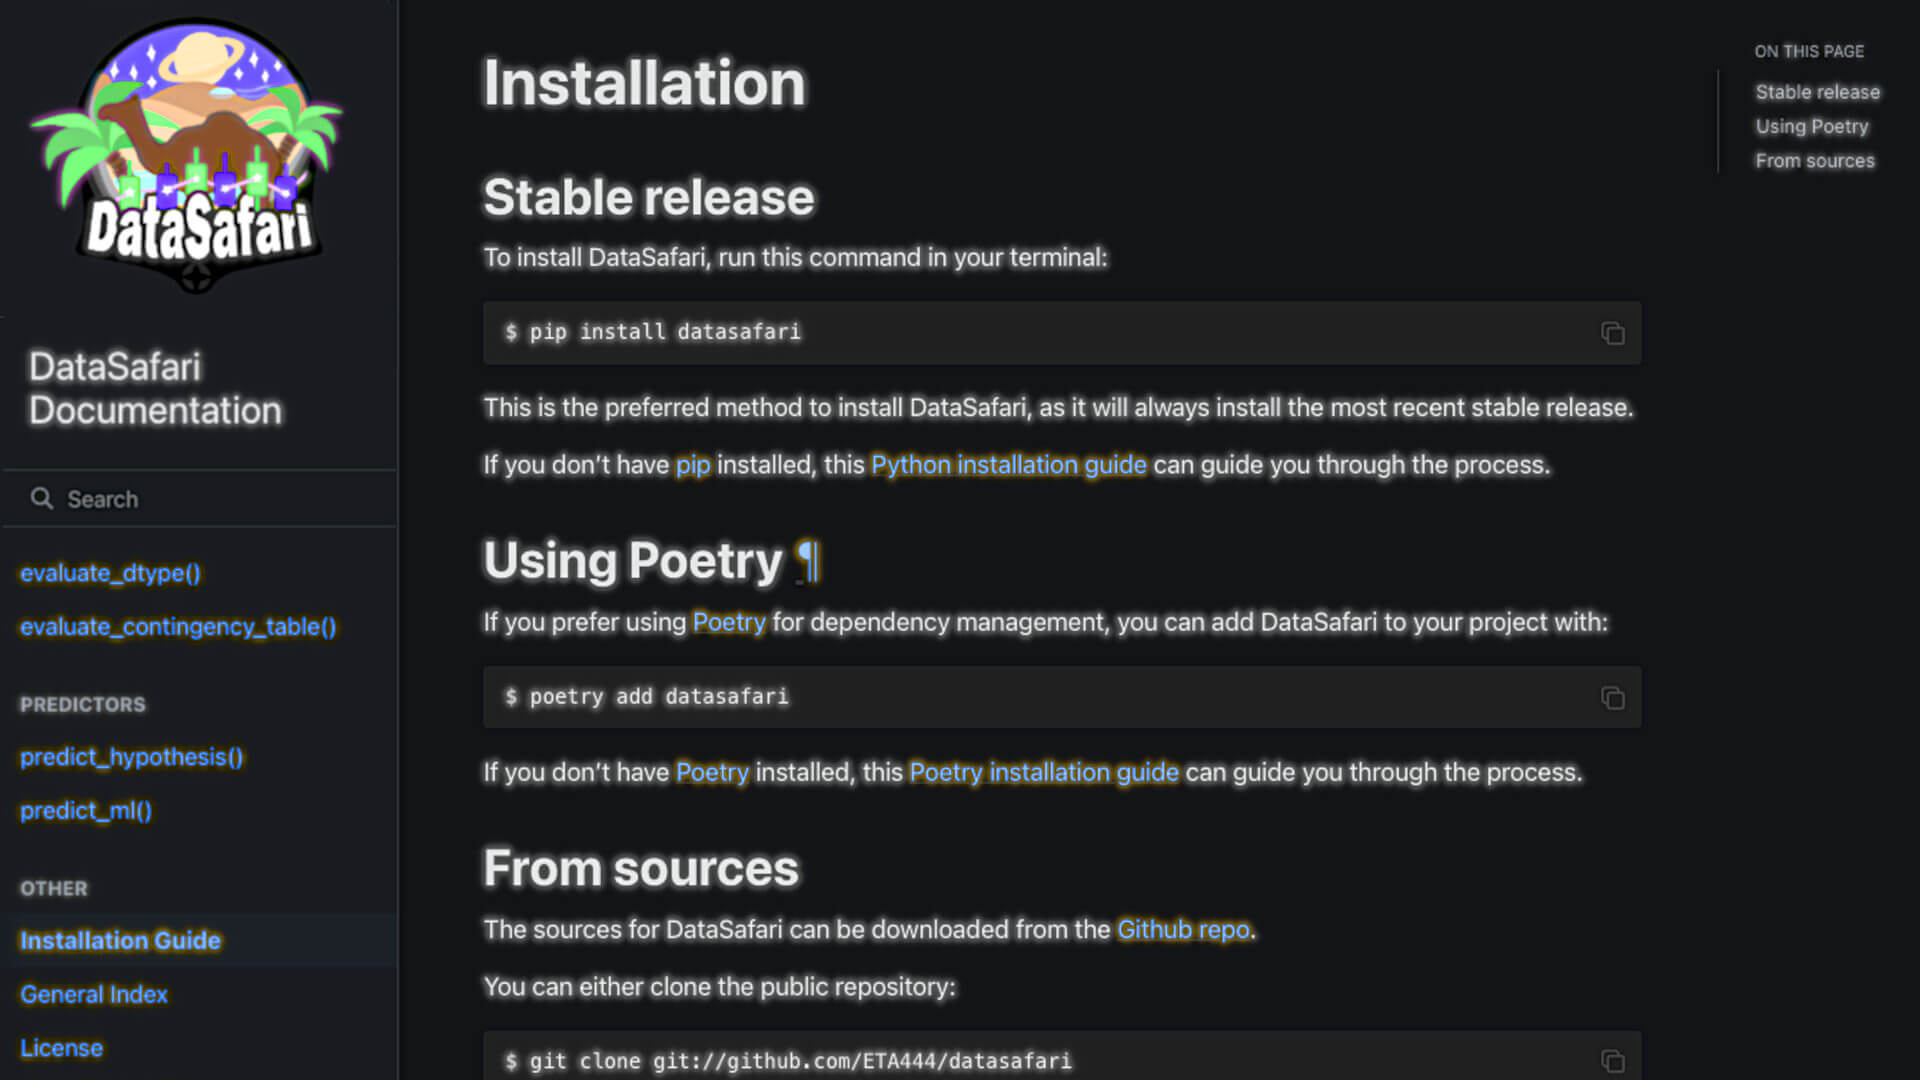
- Authored every page of the Sphinx-generated API docs: installation guides, function references, usage examples, and conceptual explanations for all 11 modules
- Integrated automated docs build and live-server deployment into the CI/CD pipeline — docs update on every push to main without manual intervention


Brand Identity & Open-Source Presence
- Created the complete DataSafari visual identity from scratch: logo, banner artwork, icon set, and all graphic assets across GitHub, PyPI, and the documentation site
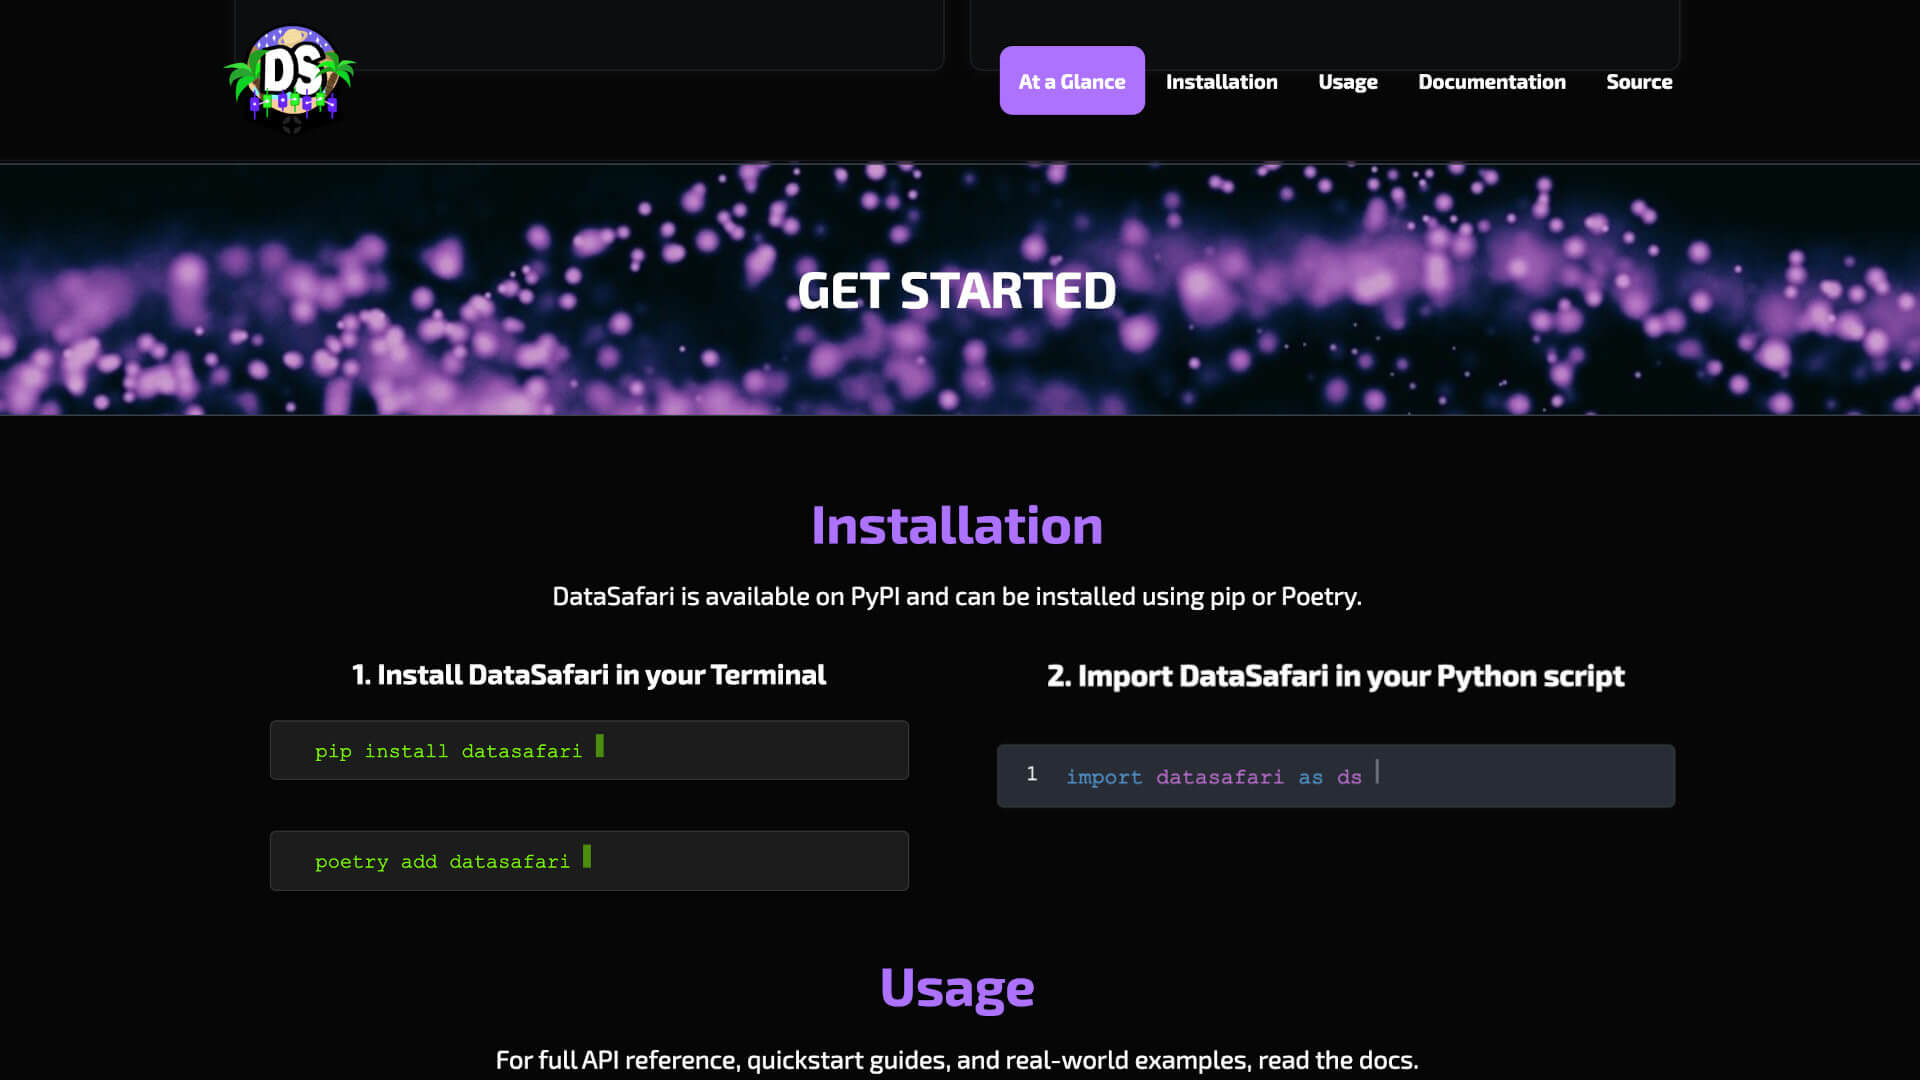
- Published to PyPI with automated versioning and structured release notes, making the library publicly installable via
pip install datasafari - Maintained a professional open-source presence: README, changelog, issue labels, and a coherent brand that makes a solo-built library read as a production-grade tool
At RUG, the standard data science curriculum ran on Stata, R, and SPSS. These tools have decades of academic inertia behind them, not necessarily because they are better, but because professors mastered them before Python became a serious data science platform and have not had time to switch. As a result, students graduate knowing tools that industry has largely moved beyond, while Python's better-maintained, faster, free, and more capable ecosystem goes untaught. Professors and other departmental staff have too much on their hands for a full curriculum redesign.
DataSafari started as a direct response to that gap. The hypothesis was simple: bring Python's best statistical and ML libraries together under a single interface that requires no configuration and produces plain-English output. That removes the adoption barrier for the person who most needs it: a researcher who knows their field, understands what a normality test is, but doesn't want to spend two hours reading scipy.stats documentation to run one. One import, one function call, and one readable report.
The iPhone analogy is imperfect but directionally useful. R is like Android: powerful, flexible, and beloved by people willing to configure it. DataSafari aims to provide an iOS-like layer on top of Python's underlying ecosystem.
That philosophy drove every product decision. It's why method='all' is the default rather than a required argument. It's why output is printed in plain English with interpretive tips instead of being returned as a raw matrix. It's why the function names are verbs such as explore, transform, evaluate, and predict. They describe what the user wants to do, not what the statistics are called. The target user was never a Python expert. It was someone who needed to do real data science work without letting the tooling become the hardest part of the day.

